AlgoTrendTraders Weekly Report - When 8 Sectors Change Direction in 7 Weeks
Disciplined, Rules-Based Trading

Thomas Meyer, Editor | February 16, 2026
Email: algotrendtraders@gmail.com | X: @AlgoTrendTrade1
Welcome to this week’s AlgoTrendTraders report. We hope you’re enjoying and learning something that helps you in these newsletters. We want you to understand how you can control your risk more effectively.
The data and charts shown in this report are not meant to be recommendations and no buy/sell information is inferred. Please read the disclaimer underneath the charts.
Tom’s Musings
The past few weeks, I’ve talked about the rotation occurring in the market. This week, both the Real Estate sector and the Utilities sector turned bullish. These sectors, especially Real Estate, had underperformed for a long time.
I thought it would make sense to show what’s happened with the sectors in the past 7 weeks. On December 29th, we had 7 bullish sectors, 3 neutral sectors, and 1 bearish sector. This week, we have 7 bullish sectors and 4 neutral sectors. Pretty much the same, right?
But take a look at this comparison. Of the 11 sectors, 8 have changed their condition. That’s a lot of change in a short period of time.

The only sector trading below the 40-week moving average is the Financials. The other 3 neutral sectors are still trading above their 40-week moving averages.
Those other 3 sectors include some of the largest stocks in the S&P 500. Names such as META, GOOGL, NVDA, AAPL, MSFT, AMZN, and TSLA which, not coincidentally, make up a large percentage of the S&P 500 overall.
It’s no surprise why the S&P 500 and the Nasdaq 100 are both off their all-time highs with these sectors moving down over the past month or so.
Rather than worry what’s going to happen with these sectors going forward, this gives traders opportunities to find stocks in the other sectors that are performing well. It takes a little more work, but there are plenty of stocks that look good with strong upward momentum.
Focusing on the current trades:
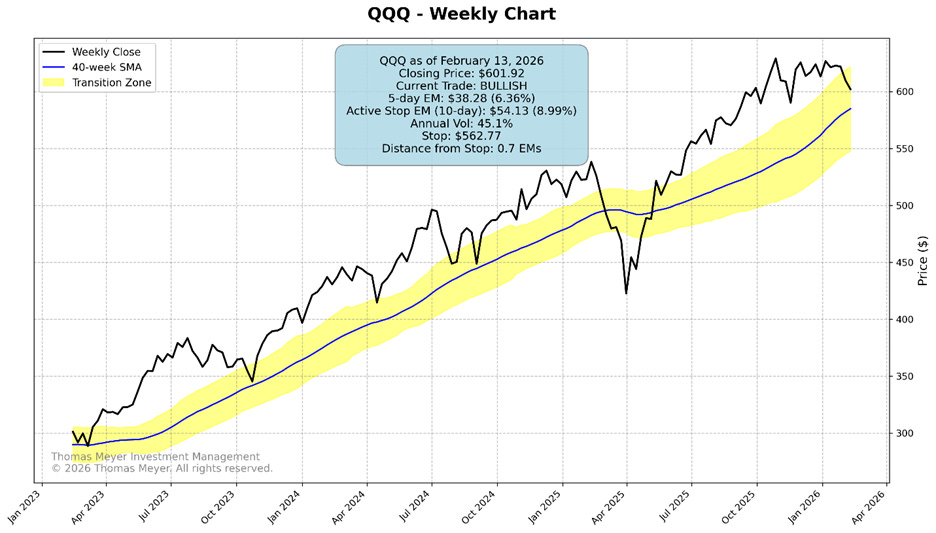
The long QQQ trade is still in place, but it is down a few percentage points. I would not enter into a new long position if you’re not already into this trade.
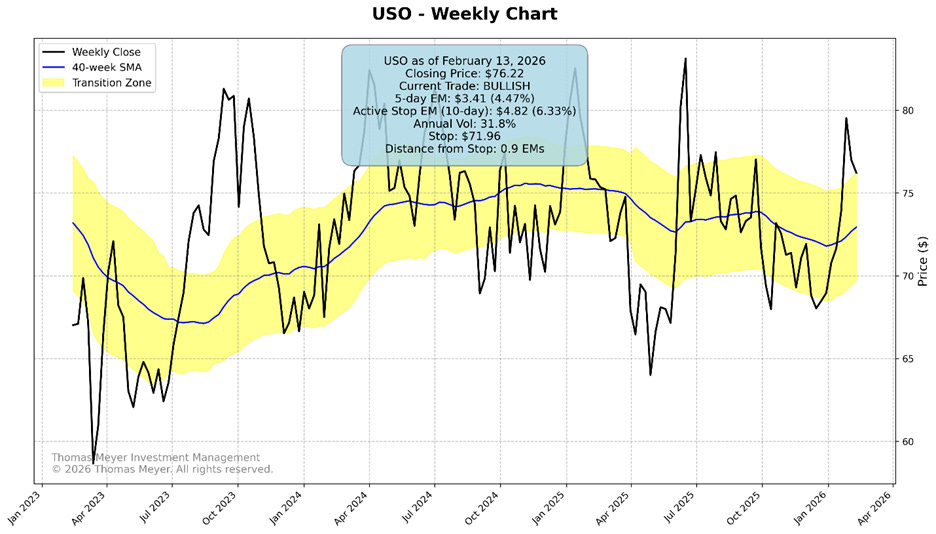
The long USO trade was entered last week. It’s down slightly. As we mentioned before, the 3-year chart on USO isn’t very optimistic for trend traders in either direction, but we never know when that will change.
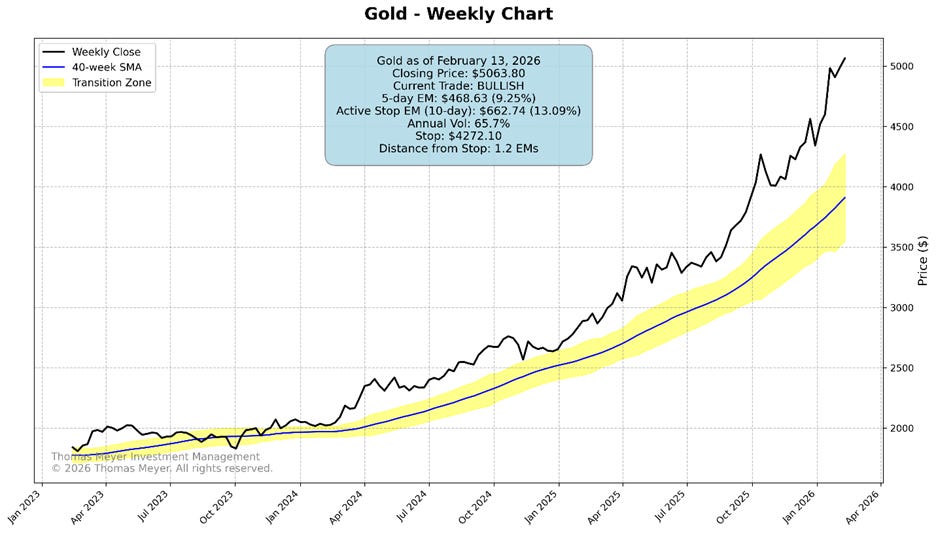
The long Gold trade has now been in place more than 13 months. The first long trade in gold was triggered more than 2 years ago when gold was barely over $2000. It hit its stop in December 2024 and 2 weeks later triggered a new long trade. That’s more than 2 years in a long trade with just a short break. The week-ending charts we use don’t show the volatility of the daily chart, especially over the past couple of months. It looks like the price could be consolidating at this higher level.
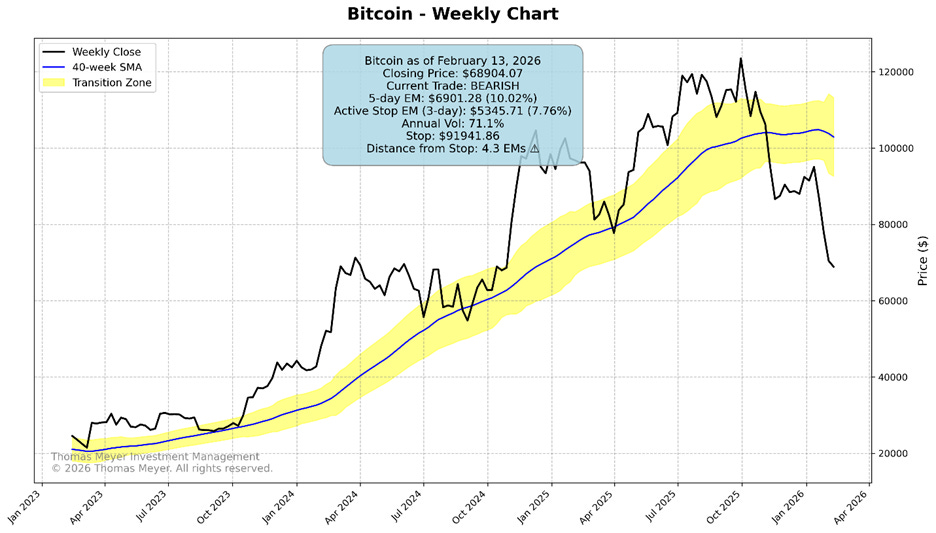
The short Bitcoin trade remains in place. Again, I know I sound like a broken record (and I’m showing my age by using that term), but please be sure you have an exit in place that locks in a profit. We could see Bitcoin move down to $50,000 or lower, and we could see it move higher in a short period of time. I don’t know what’s going to happen. I do know that there’s no reason to take a profitable trade and turn it into a losing trade.
Thomas Meyer Investment Management
If you’re not comfortable doing this on your own, and you’d like some help, there’s a simple solution. Let me do it for you! Anyone wanting to learn more about my investment management can check out the website for more information. Be sure to click on the “Let’s Connect” tab, fill it out, and we can discuss the next steps for me to manage a portion of your investable assets. By the way, I never actually hold your monies, they remain in your name, and the funds are custodied at Charles Schwab on the institutional side. Here’s my website: www.tminvestmentmanagement.com
Market Overview
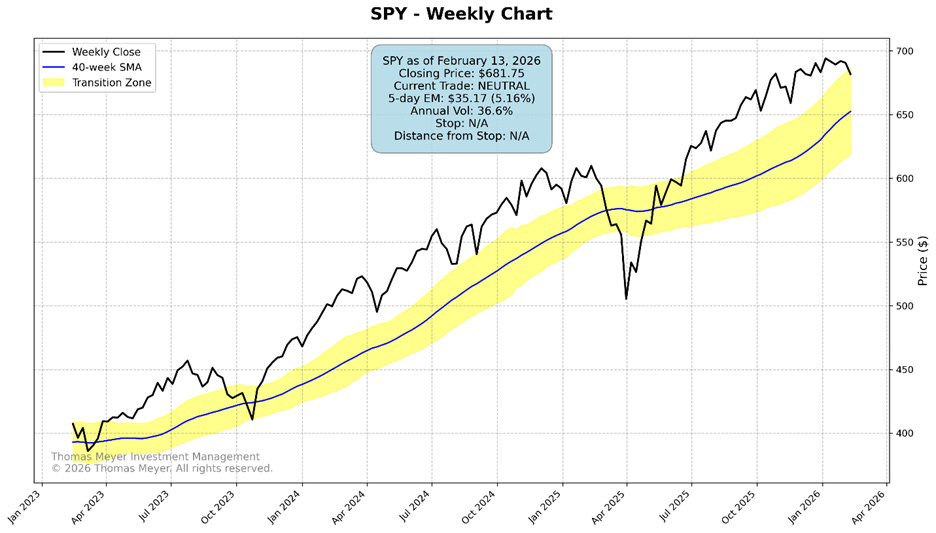
Markets continue to churn through a significant rotation. SPY remains neutral after getting stopped out two weeks ago with a 13% gain. QQQ is holding on at 0.7 Expected Moves from the exit but showing weakness—down a few percentage points from entry. If you’re not already in this trade, don’t chase it.
The USO trade was entered last week and is slightly negative. The 3-year chart doesn’t inspire confidence for trend traders, but trends can emerge when least expected.
Gold continues its remarkable run—over 13 months in this trade, now pushing past $5,000 and sitting 1.2 Expected Moves from the stop. That’s 90% profit since January 2025. This is what “letting winners run” looks like.
Bitcoin’s bearish trade keeps working. Now 4.3 Expected Moves from the stop with strong profits. Lock in gains with a trailing stop—this could reverse sharply in either direction.
Historical Results For SPY, QQQ, Bitcoin
The trend-following approach I use has a decade-long track record across multiple newsletters in three countries. Here are the results for SPY, QQQ, and Bitcoin since I started publishing on Substack:
Always have your exit strategies prepared before you enter into any trade.

Current Conditions for February 16, 2026

Be Sure to Read the Disclaimer at the End of This Report
Here are the latest charts…
SPY (SPDR S&P 500 ETF)
Friday’s Closing Price: 681.75
Current Condition: Neutral
Weekly Expected Move: 35.17 (5.16%)
Stop: N/A
Distance from Stop: N/A
QQQ (Invesco NASDAQ 100 ETF)
Friday’s Closing Price: 601.92
Current Condition: Bullish
Weekly Expected Move: 38.28 (6.36%)
Stop: 562.77
Distance from Stop: 0.7 Expected Moves
Current Trade Entry Price: 618.70
Current Trade Entry Date: 02 February 2026
USO (USCF Crude Oil ETF)
Friday’s Closing Price: 76.22
Current Condition: Bullish
Weekly Expected Move: 3.41 (4.47%)
Stop: 71.96
Distance from Stop: 0.9 Expected Moves
Current Trade Entry Price: 76.83
Current Trade Entry Date: 09 February 2026
Gold (Current Futures Contract)
Friday’s Closing Price: 5,063.80
Current Condition: Bullish
Weekly Expected Move: 468.63 (9.25%)
Stop: 4,272.10
Distance from Stop: 1.2 Expected Moves
Current Trade Entry Price: 2,652.80
Current Trade Entry Date: 06 January 2025
BTC (Bitcoin)
Sunday’s Closing Price: 68,904.07
Current Condition: Bearish
Weekly Expected Move: 6,901.28 (10.02%)
Stop: 91,941.86
Distance from Stop: 4.3 Expected Moves
Current Trade Entry Price: 87,041.62
Current Trade Entry Date: 26 January 2026
Understanding Trend-Following
For new readers: here’s what this system is and why it works.
Trend-following isn’t about getting rich quick. It’s about attempting to make money slowly—and keeping it. This system relies on a proven process: capture solid gains on winning trades while limiting losses on trades that don’t work out. We’re the tortoise, not the hare.
The Core Principle
We don’t try to predict the market’s next move. Instead, we measure what’s actually happening each week and follow the evidence. Our algorithms determine the current trend and calculate exit strategies based on each security’s normal volatility.
Why Weekly Data Matters
By using weekly closes, we ignore the day-to-day noise that causes most investors to make emotional decisions. This gives us clearer signals and better long-term results.
How Risk Management Works
When a trade moves against us, we exit with a small, controlled loss. But when a trade trends for months—like our current Gold position, up 90% over 13 months—we let it run as long as the trend remains intact. This asymmetry is how trend-following generates wealth over time.
Entry Timing
The best time to enter is when a fresh signal triggers—you’re getting in at the start of a potential long trend. Entering mid-trend is possible but riskier. If you’re chasing a trade that’s already well-established, consider using half or one-third of your normal position size.
A Word on Leverage
Experienced investors sometimes use options or leverage with trend-following signals. This amplifies both gains and losses. Never risk more than you can afford to lose—no matter how confident you feel about a trade.
The Bottom Line
Trend-following requires patience and discipline. But for investors who want to participate in market gains while protecting against catastrophic losses, it’s one of the most reliable strategies ever developed.
Disclaimer
The information published in this newsletter should not be used to make personal investment decisions. We do not know your personal financial situation. Investments should be made only after consulting with your professional investment advisor and only after reviewing the prospectuses or financial statements of the companies in which you’re considering investing.