AlgoTrendTraders Weekly Report - December 1, 2025
Disciplined, Rules-Based Trading

AlgoTrendTraders Weekly Report
Thomas Meyer, Editor | December 1, 2025
Email: algotrendtraders@gmail.com | X: @AlgoTrendTrade1
IMPORTANT DISCLAIMER: The information published in this newsletter should not be used to make personal investment decisions. We do not know your personal financial situation. Investments should be made only after consulting with your professional investment advisor and only after reviewing the prospectuses or financial statements of the companies in which you’re considering investing.
Executive Summary
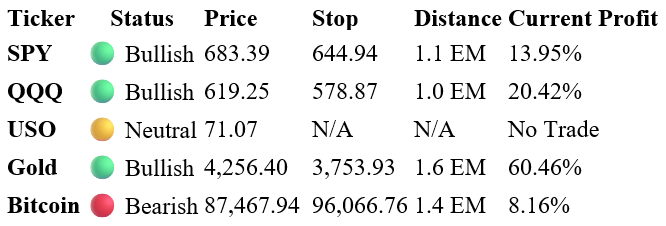
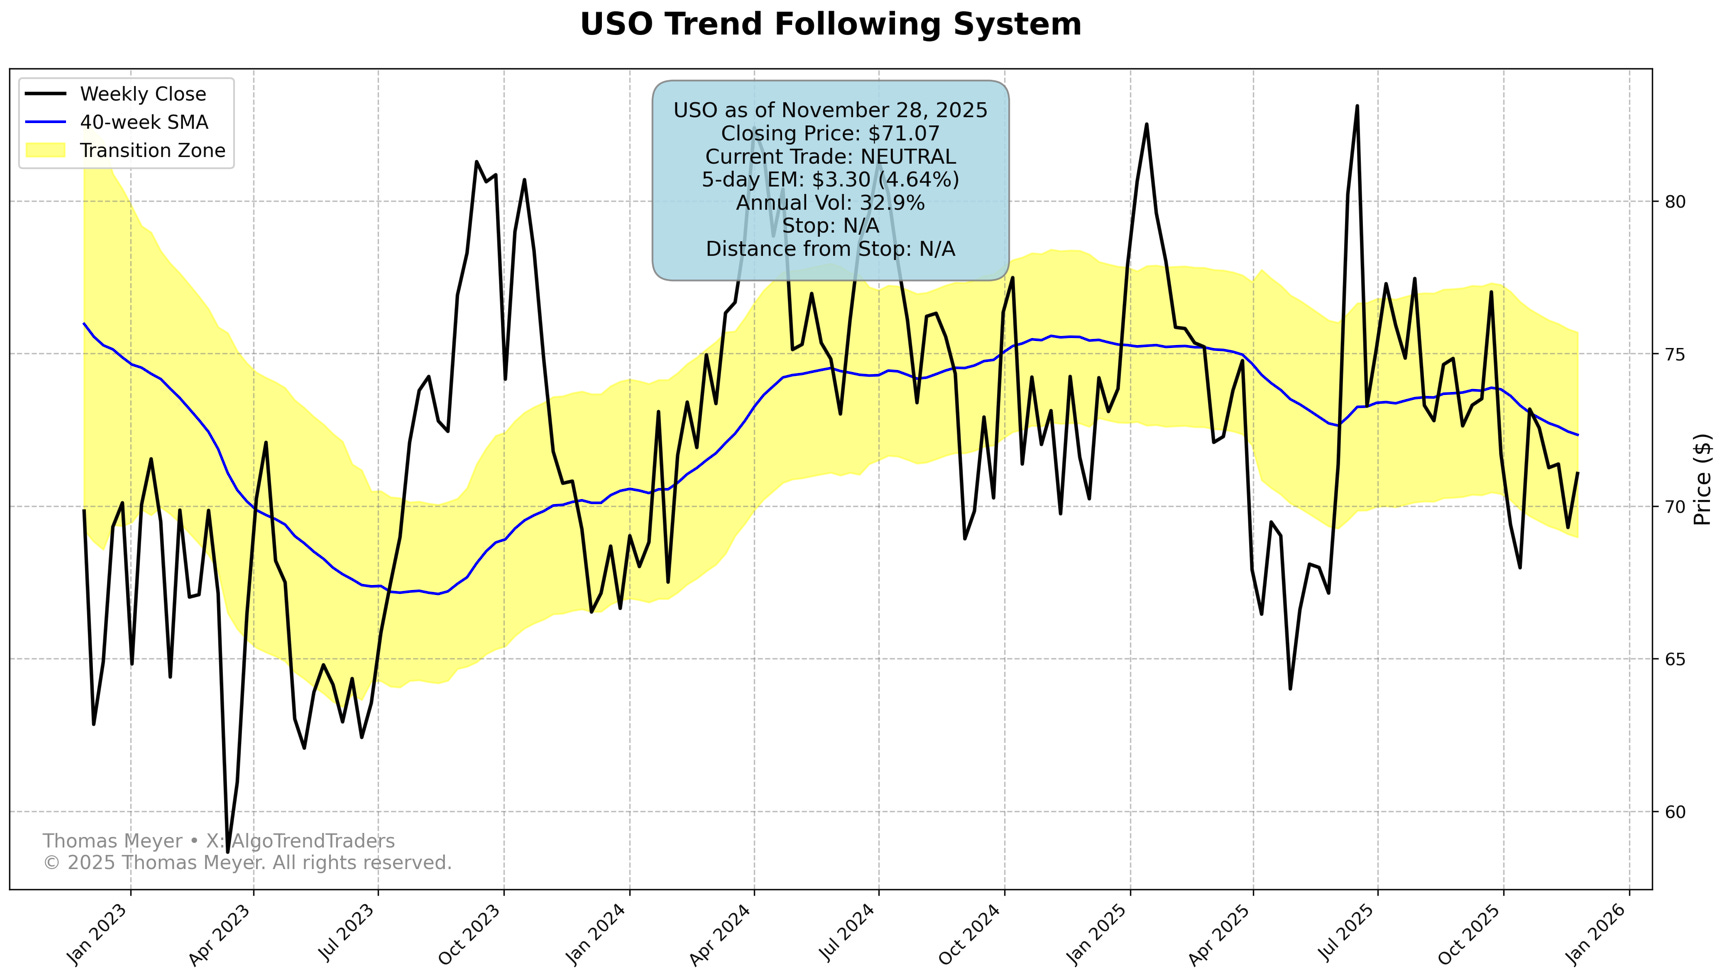
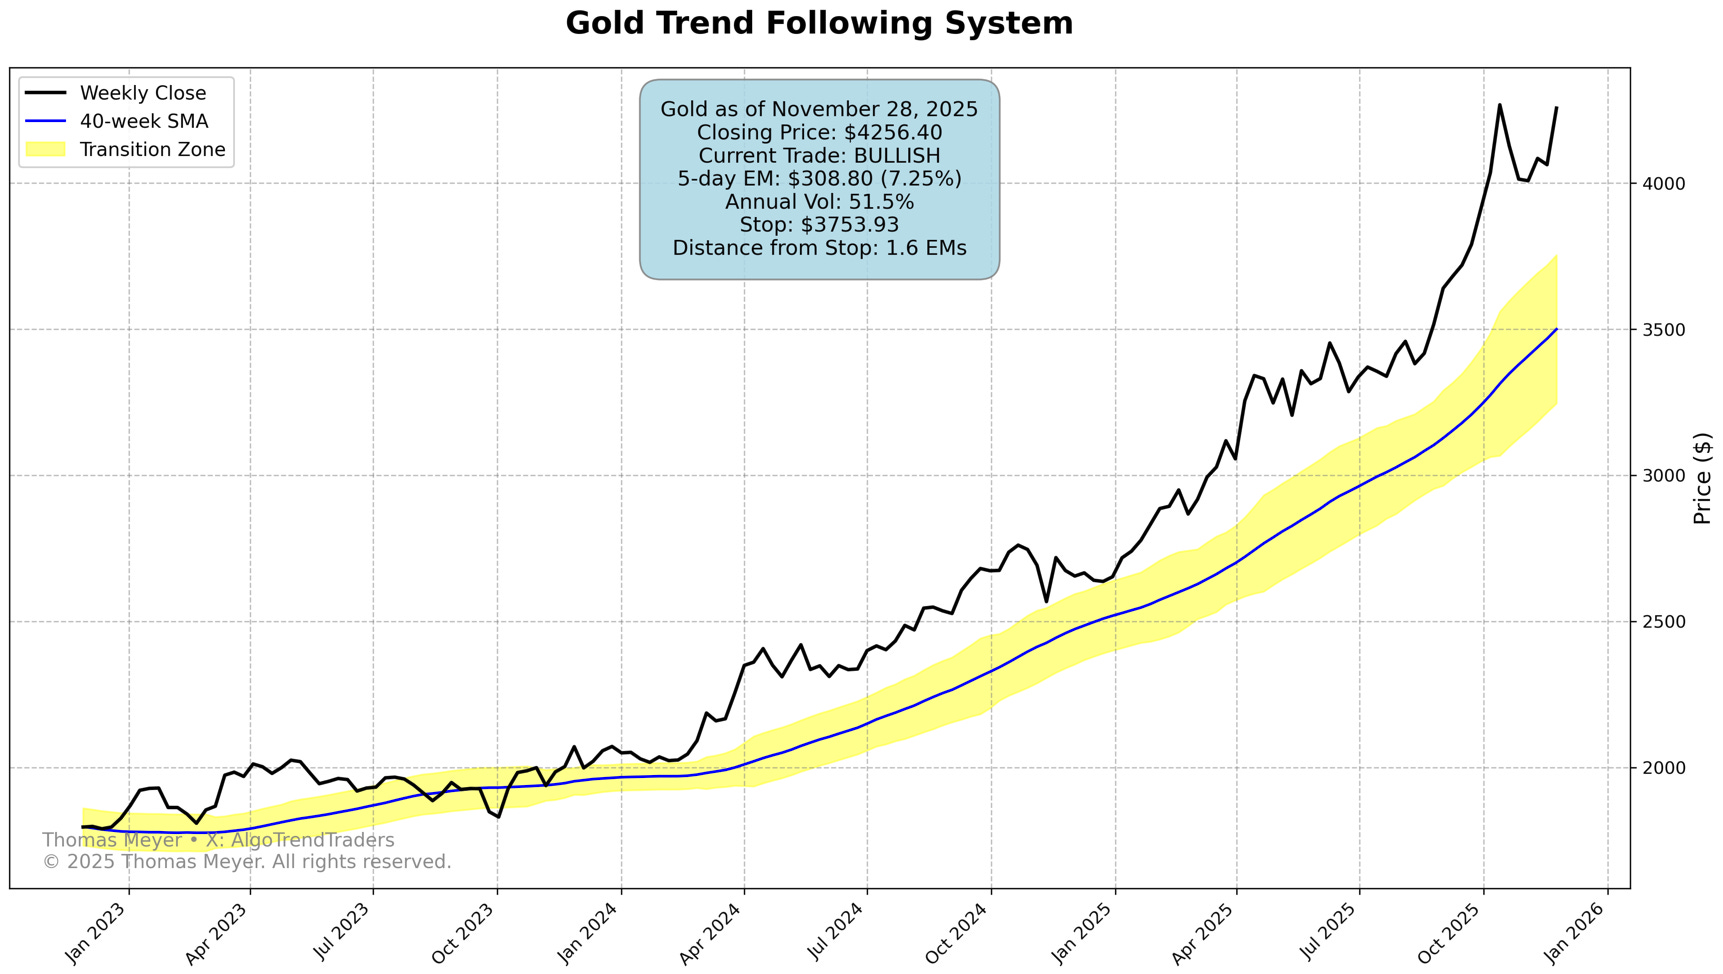
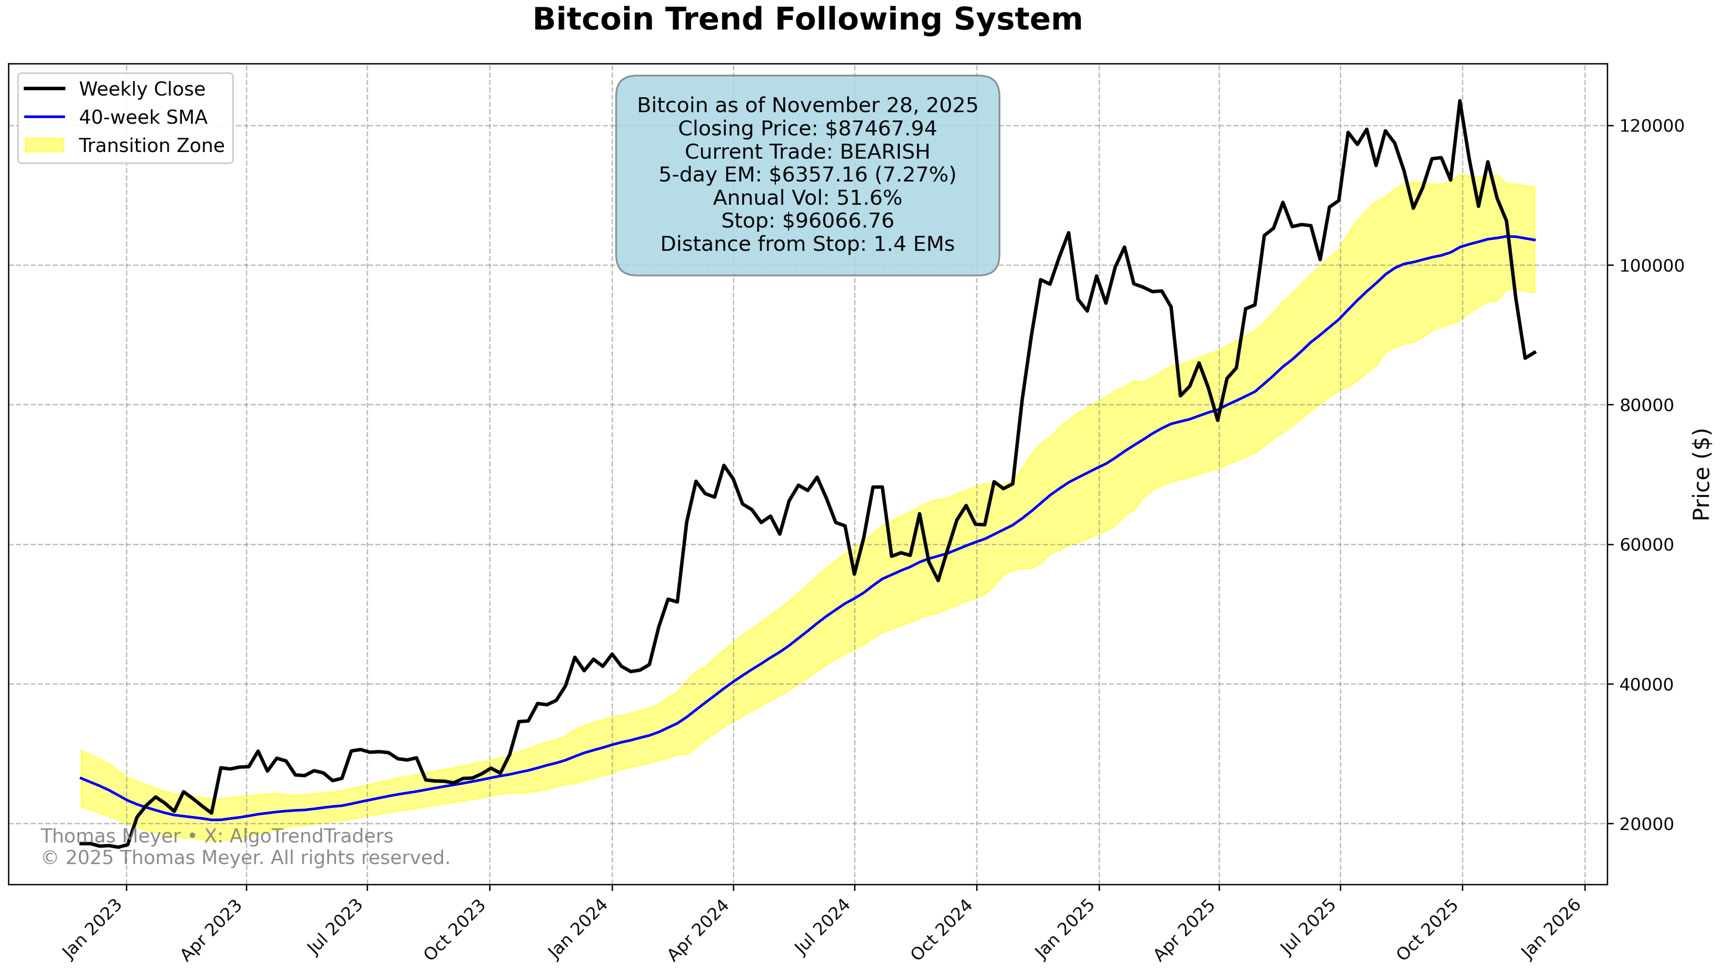
Strong market rally drives broad sector strength with 8 bullish sectors - strongest positioning in weeks. SPY and QQQ extend gains but remain within striking distance of stops. Gold consolidates near highs with comfortable 1.6 EM cushion. Bitcoin bearish trade profits 8.16% as price drops to 87,467.94 after just two weeks.
Tom’s Musings
I’ve been using ChatGPT to help with these newsletters for the past couple of months. I like the output and clarity, but one thing missing when published is a deeper dive into trend-following history. A recent tweet got me thinking about “lost decades” in the stock market.
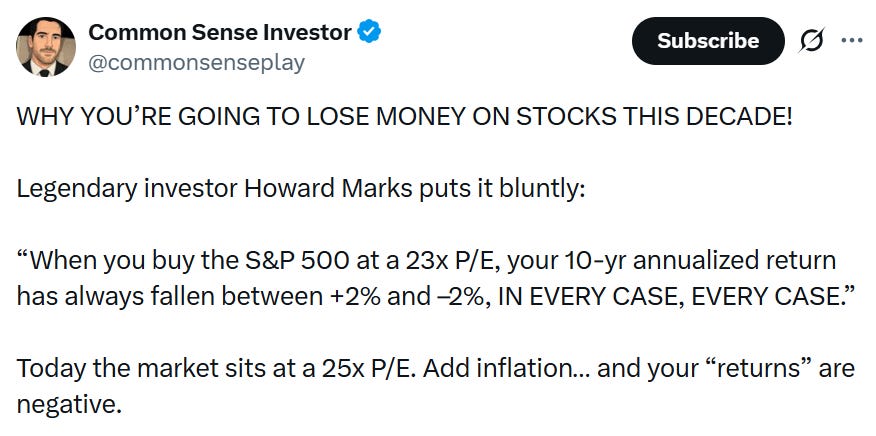
(Here’s the link if you want to check out the entire tweet: https://x.com/commonsenseplay/status/1989140372698853654)
A lost decade is when the market ends at the same point it started 10+ years earlier. We know 2000-2012 was a lost decade. The S&P 500 was around 1560 in March 2000, dropped 50% into fall 2002, moved back to highs in 2007, dropped 55% into early 2009, and finally moved above March 2000 levels at the end of 2012.
During that same period, the trend-following strategy test did fantastic. SPY trades were up 67% over the same timeframe and QQQ trades were up 177%. Remember, this is based on a backtest, not real results. But even assuming trend-following returns were half that, it’s still a positive result during a very difficult timeframe.
This is the type of market condition where trend-following shines. The same conditions occurred from the early 1970s until the 1980s, and trend-followers did well when most investors did poorly.
Do your own research. You might want to consider allocating a portion of your investible assets into a trend-following strategy for the next decade or so. Keep in mind that trend-following will likely underperform during bullish markets. That doesn’t mean you can’t do well, but buy-and-hold will likely outperform. However, during “lost decades”, the best place to succeed could be in a trend-following strategy. And with valuations this high, the odds of another “lost decade” could be increasing.
Next week, we’ll do a deeper dive into this specific trend-following strategy we use in this newsletter. I’ll also be doing a webinar on Thursday evening, December 11th for those interested in learning more. I’ll have the link for you next week.
Current Market Status
Active Trades & Exits
Key Developments
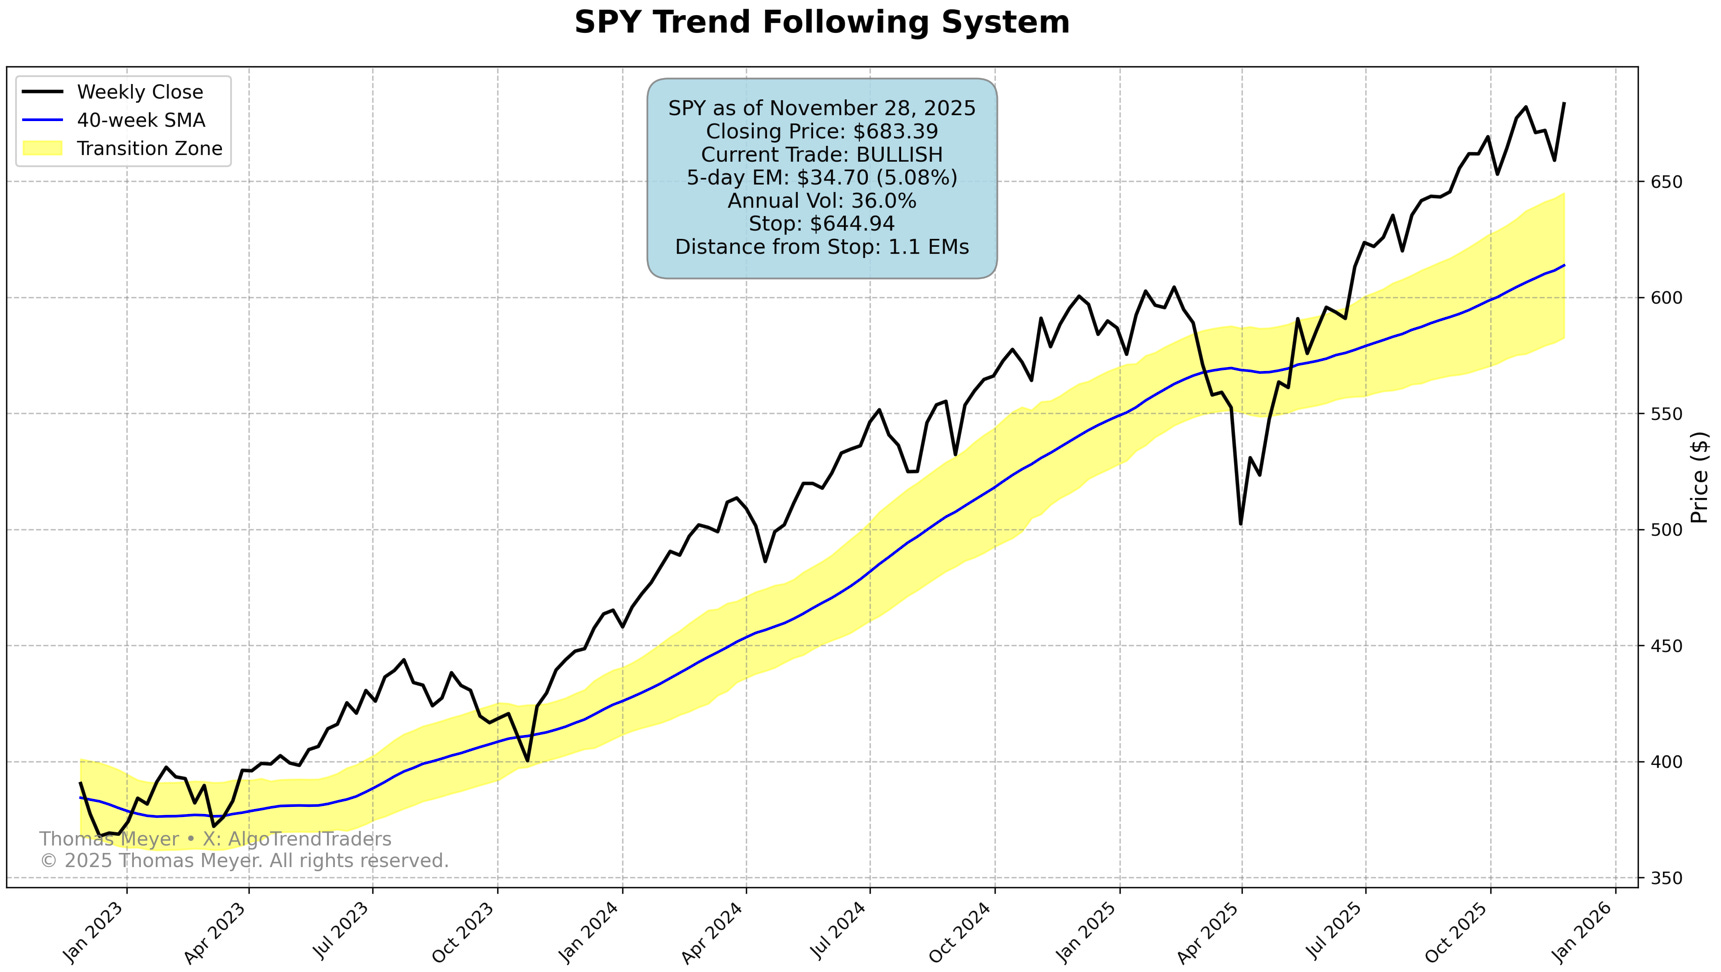
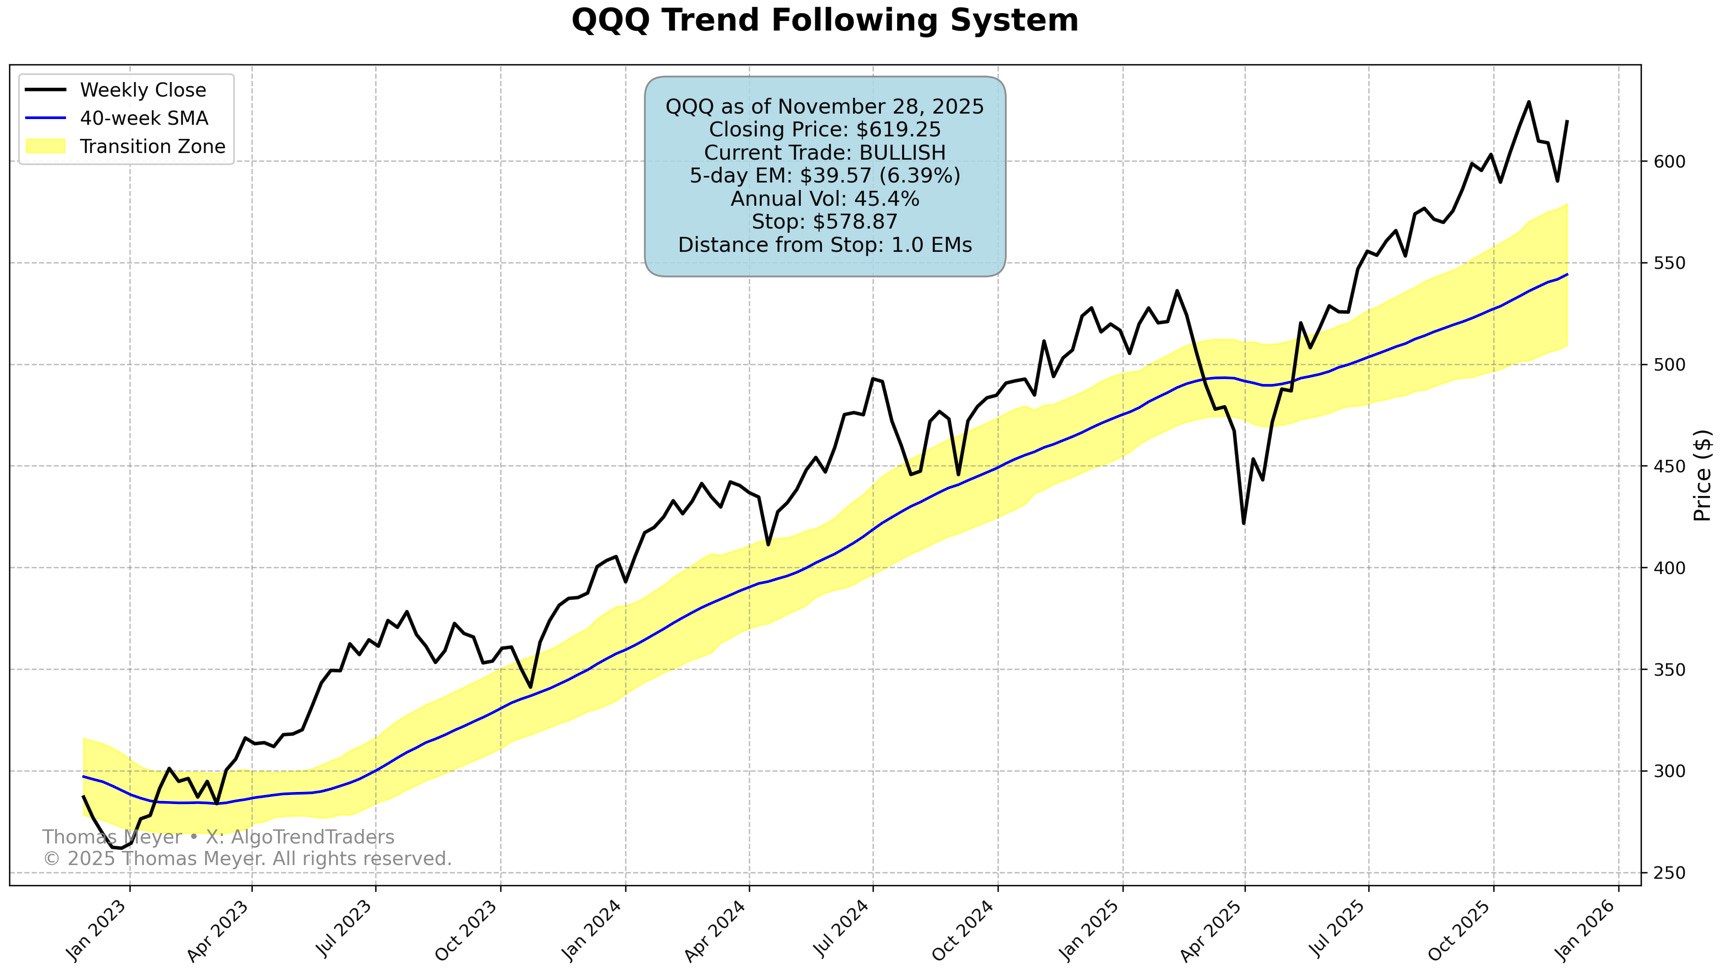
📈 Market Strength Returns: Broad rally brings sectors back to bullish conditions. SPY at 683.39 and QQQ at 619.25 show strong momentum, though both remain within 1.0-1.1 EM of stops. Profits extend to 13.95% and 20.42% respectively.
🥇 Gold Near All-Time Highs: Consolidates at 4,256.40 with impressive 60.46% profit since January entry. Maintains comfortable 1.6 EM distance from stop at 3,753.93 - strongest position in portfolio.
₿ Bitcoin Short Profitable: Two-week-old bearish trade continues working as price drops to 87,467.94. Now showing 8.16% profit with stop 1.4 EM away. Consider using 1 EM trailing stop at $93,824.10 to lock in gains if Bitcoin rebounds.
📊 Sector Breadth Expands: Three sectors flip from neutral to bullish (XLF, XLI, XLY). Now 8 bullish sectors vs. 5 last week - significant improvement. XLV strongest at 2.9 EM from stop, approaching overbought levels.
⚡ Volatility Remains Elevated: Expected Moves still wide - SPY 5.08%, QQQ 6.39%, Gold 7.25%, Bitcoin 7.27%. Market uncertainty continues despite rally.
S&P 500 Sectors At-a-Glance
🟢 Bullish (8): Communications (XLC), Energy (XLE), Financials (XLF), Industrials (XLI), Technology (XLK), Utilities (XLU), Healthcare (XLV), Discretionary (XLY)
🟡 Neutral (3): Materials (XLB), Staples (XLP), Real Estate (XLRE)
🔴 Bearish (0): None
Three sectors strengthen: XLF, XLI, and XLY flip from neutral to bullish - market breadth significantly improved from last week
Portfolio Services
Thomas Meyer Investment Management
Not comfortable managing trades yourself? I can handle it for you. Funds stay in your name at Charles Schwab institutional.
Learn more: tminvestmentmanagement.com
Charts
System Performance Through November 30, 2025
Why Trend-Following Works
The Problem with Buy-and-Hold: When you need your money (retirement, medical, education), a 30-50% loss at the wrong time can derail your plans forever.
The Solution: Disciplined exit strategies. Every trade has a predetermined stop-loss based on the security’s normal volatility. Small losses, big wins.
Key Principles:
Follow trends until they break
Weekly closes eliminate daily noise
Risk management is more important than being right
Boring but historically effective
Trading Methodology
The Yellow Channel System:
Above yellow zone = 🟢 Bullish (go long)
In yellow zone = 🟡 Neutral (no trade)
Below yellow zone = 🔴 Bearish (go short)
Exit Strategy: Based on each security’s 52-week volatility (”Expected Move”). Stops move up with profitable trades but never down.
Best Entry: When new signals trigger. Late entries carry higher risk - consider smaller position sizes.
Remember: Always have your exit strategy prepared before entering any trade.
This is not a “get-rich-quick” scheme. Trend-trading requires discipline, patience, and proper risk management. Past performance does not guarantee future results.