
Thomas Meyer, Editor
July 11, 2022
Twitter: @AlgoTrendTrade1
Email: algotrendtraders@gmail.com
Welcome to this week’s AlgoTrendTraders Weekly Commodity report. Before we get into this week’s report, be sure to follow us on Twitter: @AlgoTrendTrade1 for updates.
Please send any questions you have to the email address listed above and we’ll share them in these reports. If there’s something you don’t understand, there’s probably a good chance others don’t understand it either.
Final Issue of AlgoTrendTraders on July 25th
Both of the AlgoTrendTraders weekly reports will end in two weeks. It’s been a pleasure creating these reports and delivering profitable trades over the past year. The markets have been difficult, but the methodology has proven itself on both the bullish and bearish sides. I appreciate your taking the time to read these.
Two Stop Outs and One New Trade
The bullish trades in WTI Crude Oil and Soybeans each hit their respective stops last week and are now in Neutral conditions. The trade in oil lost -8.72% off a previous gain of +37.25%. The trade in Soybeans lasted a little more than 5 months and closed with a gain of +7.09%. The only remaining bullish trade is in Corn.
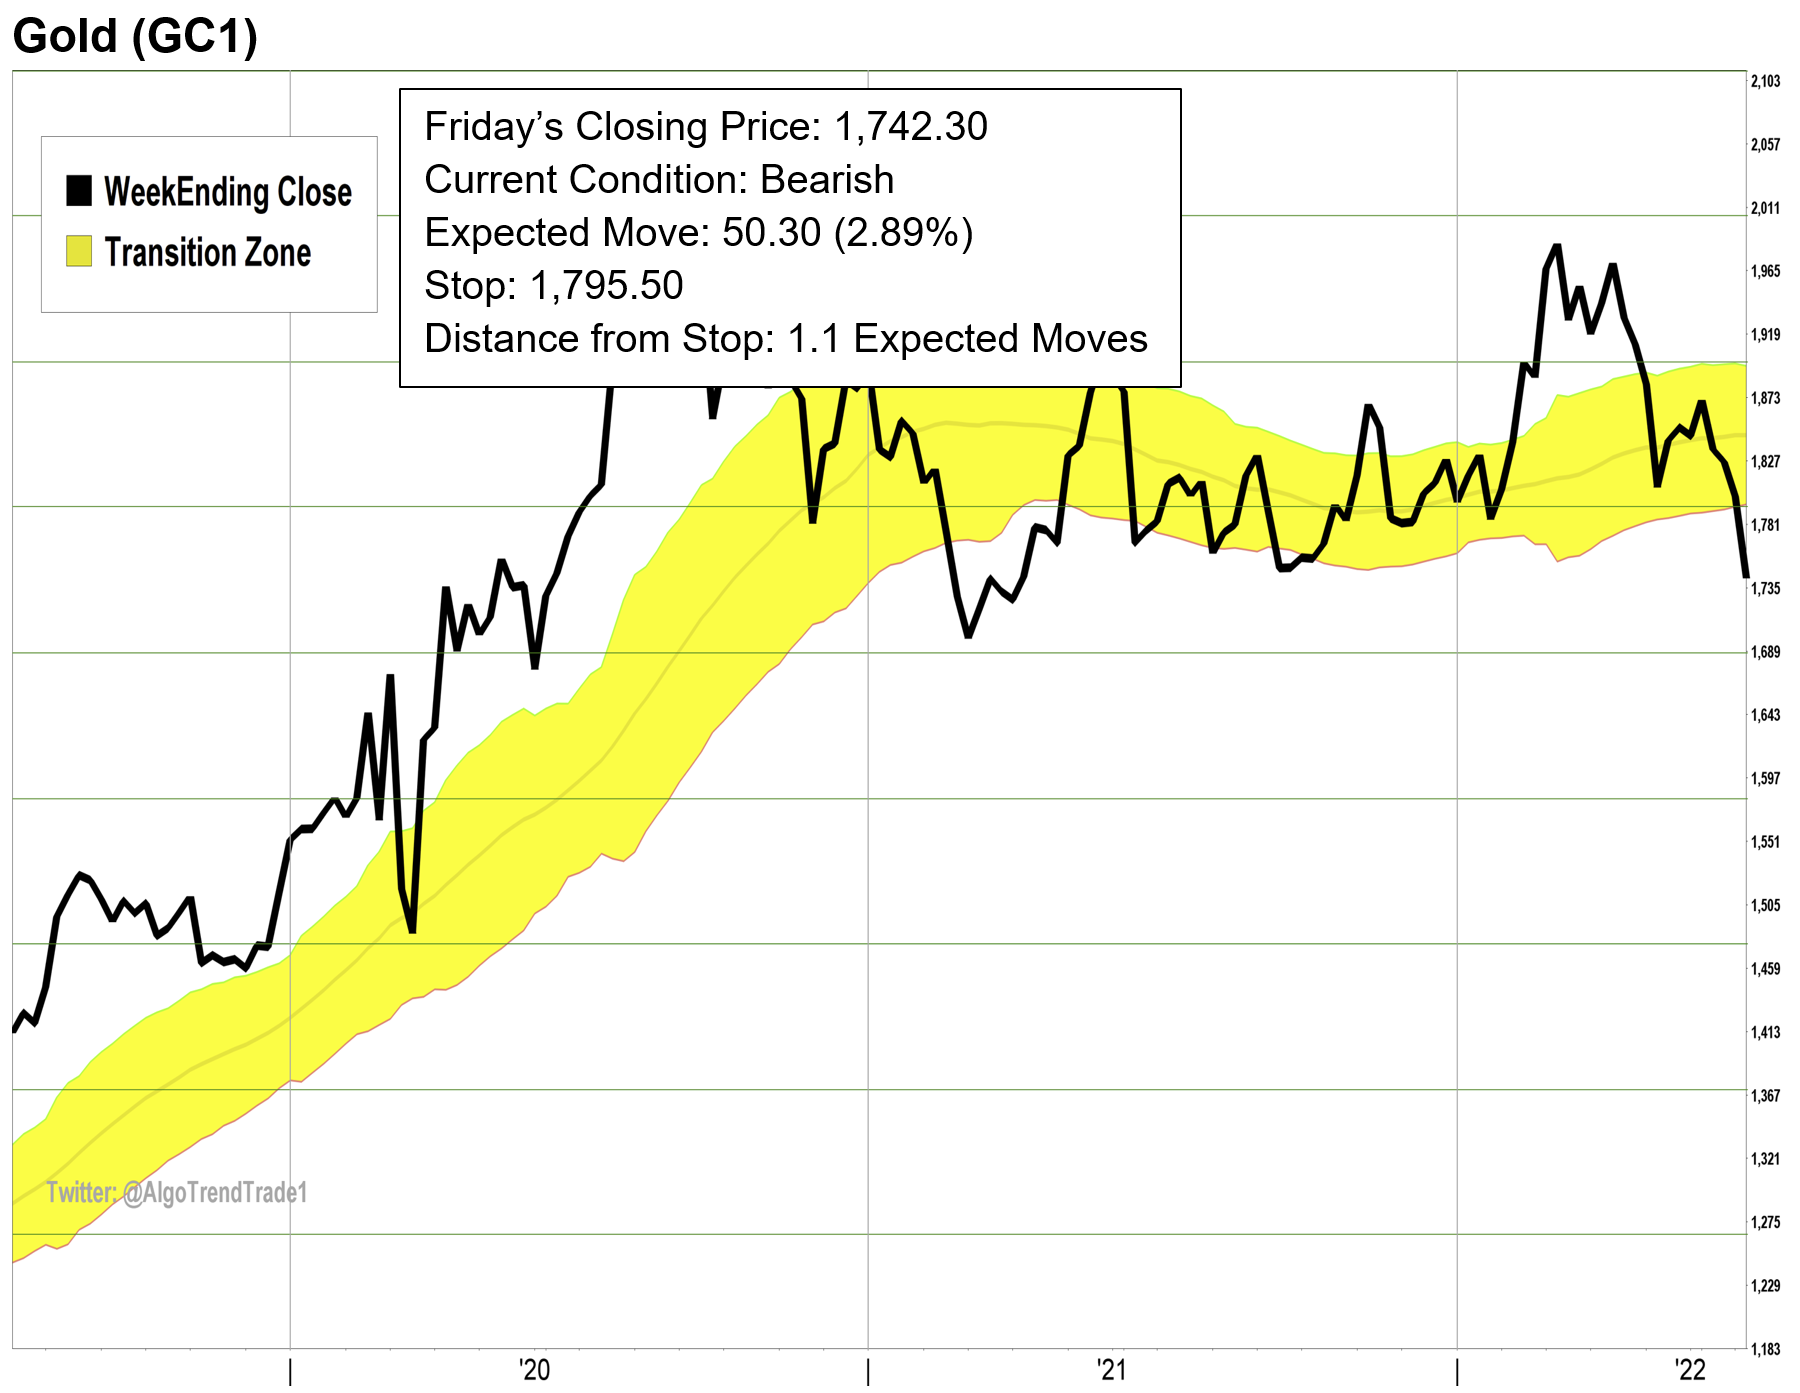
Gold dropped sharply last week and triggered a new bearish trade. The details are listed below.
The Natural Progression of Trend-Trading
Trend-trading seems easy, a stock or commodity moves from a Bearish condition to a Neutral condition and then to a Bullish condition. And the trends should last a long time. That’s the theory at least. In reality, we can move from a Bullish condition to a Neutral condition, back to Bullish, back to Neutral, then to Bearish, then back to Neutral, back to Bearish, etc. It’s not always easy.
That’s why we only risk a small amount on any individual trade. If the trade moves against us, we’ll only lose a little. When we get trends that last a long time, we can greatly outperform our losing trades. In the 10+ months since we’ve been publishing the AlgoTrendTraders Weekly Commodity Report, we’ve had 26 trades that have closed. Of these 26 trades, 17 were losing trades and only 9 were winning trades. But the average winning trade was +18.81% and the average losing trade was only -4.61%. That puts the average result of all 24 trades at +3.49%. Those are just the results of the underlying prices and doesn’t take into account the leverage used in commodity trading. This also doesn’t include the current profitable trades in Silver, Copper, and Corn.
For those wanting to know more about Trend Trading
The overview of the AlgoTrendTraders system is underneath the charts. Those familiar with our methodology can get right to the trades. If you’re new to trend-trading, be sure to read this introductory section. This will help you understand the concept of trend-trading and why it’s so powerful.
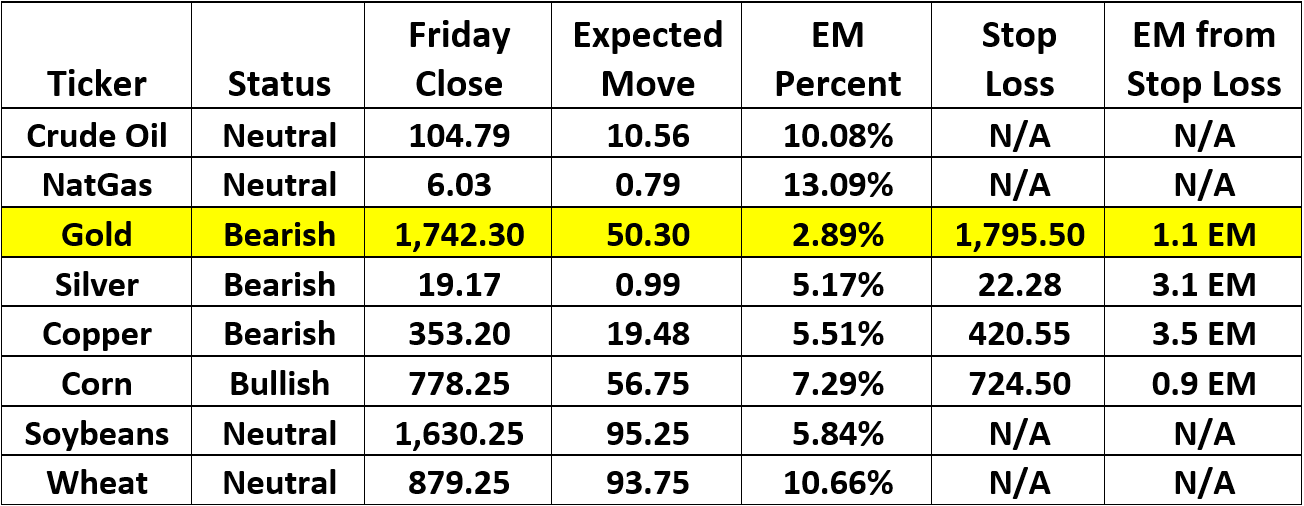
Each week, we show you the Composite Table that has the week-ending price, current volatility, and the updated exit strategy for each of the commodities.
We say this a lot because it’s the most important element for successful investing… Always have your exit strategies prepared before you enter into any trade.
The Composite Table for July 11, 2022
Be Sure to Read the Disclaimer at the End of This Report
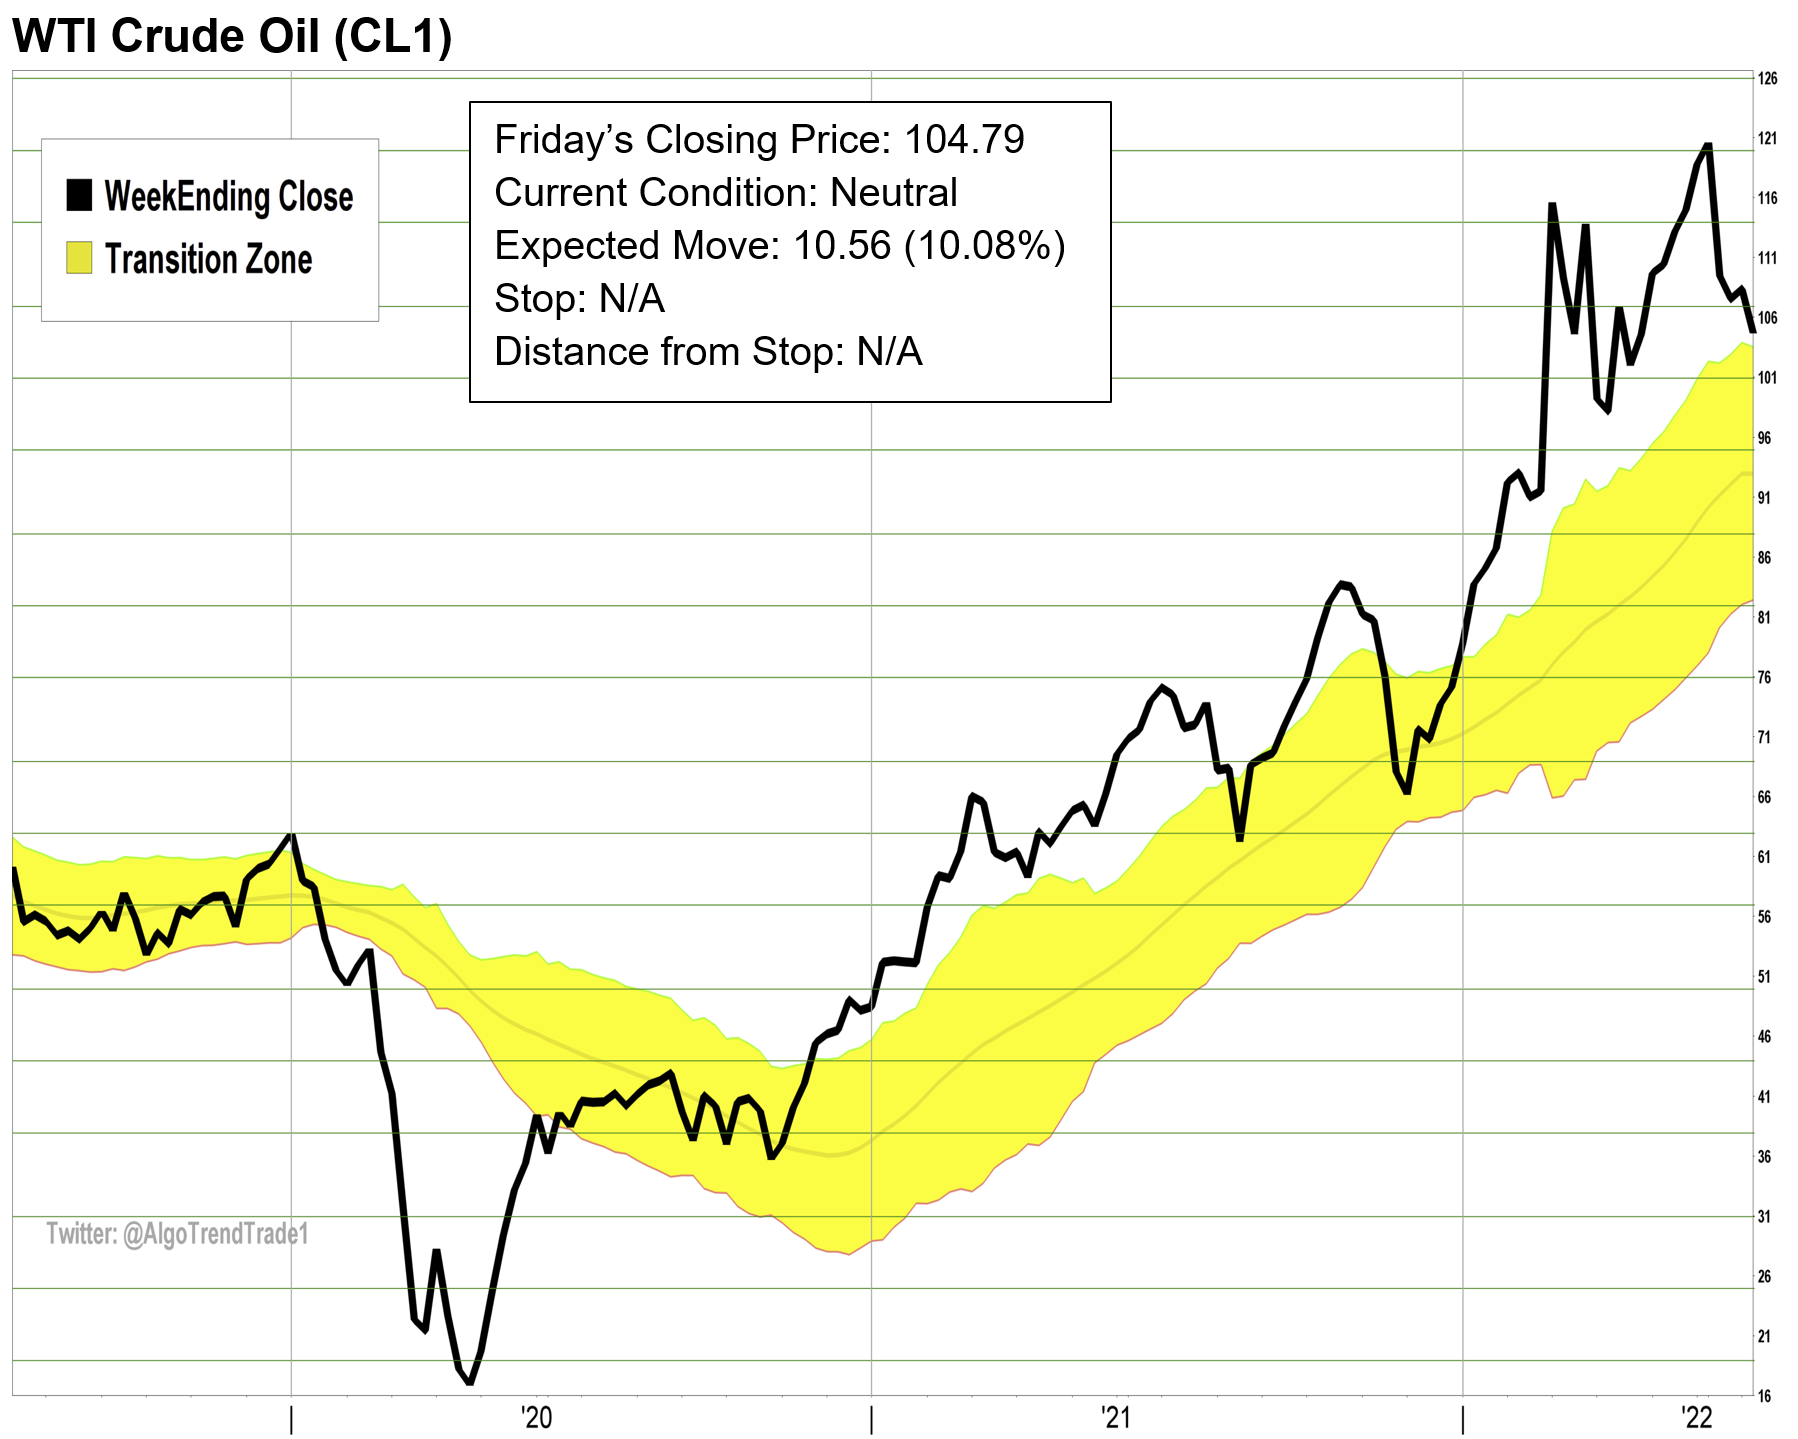
WTI Crude Oil closed lower last week and hit its listed stop. WTI Crude is now in a Neutral condition. There is no trade this week.
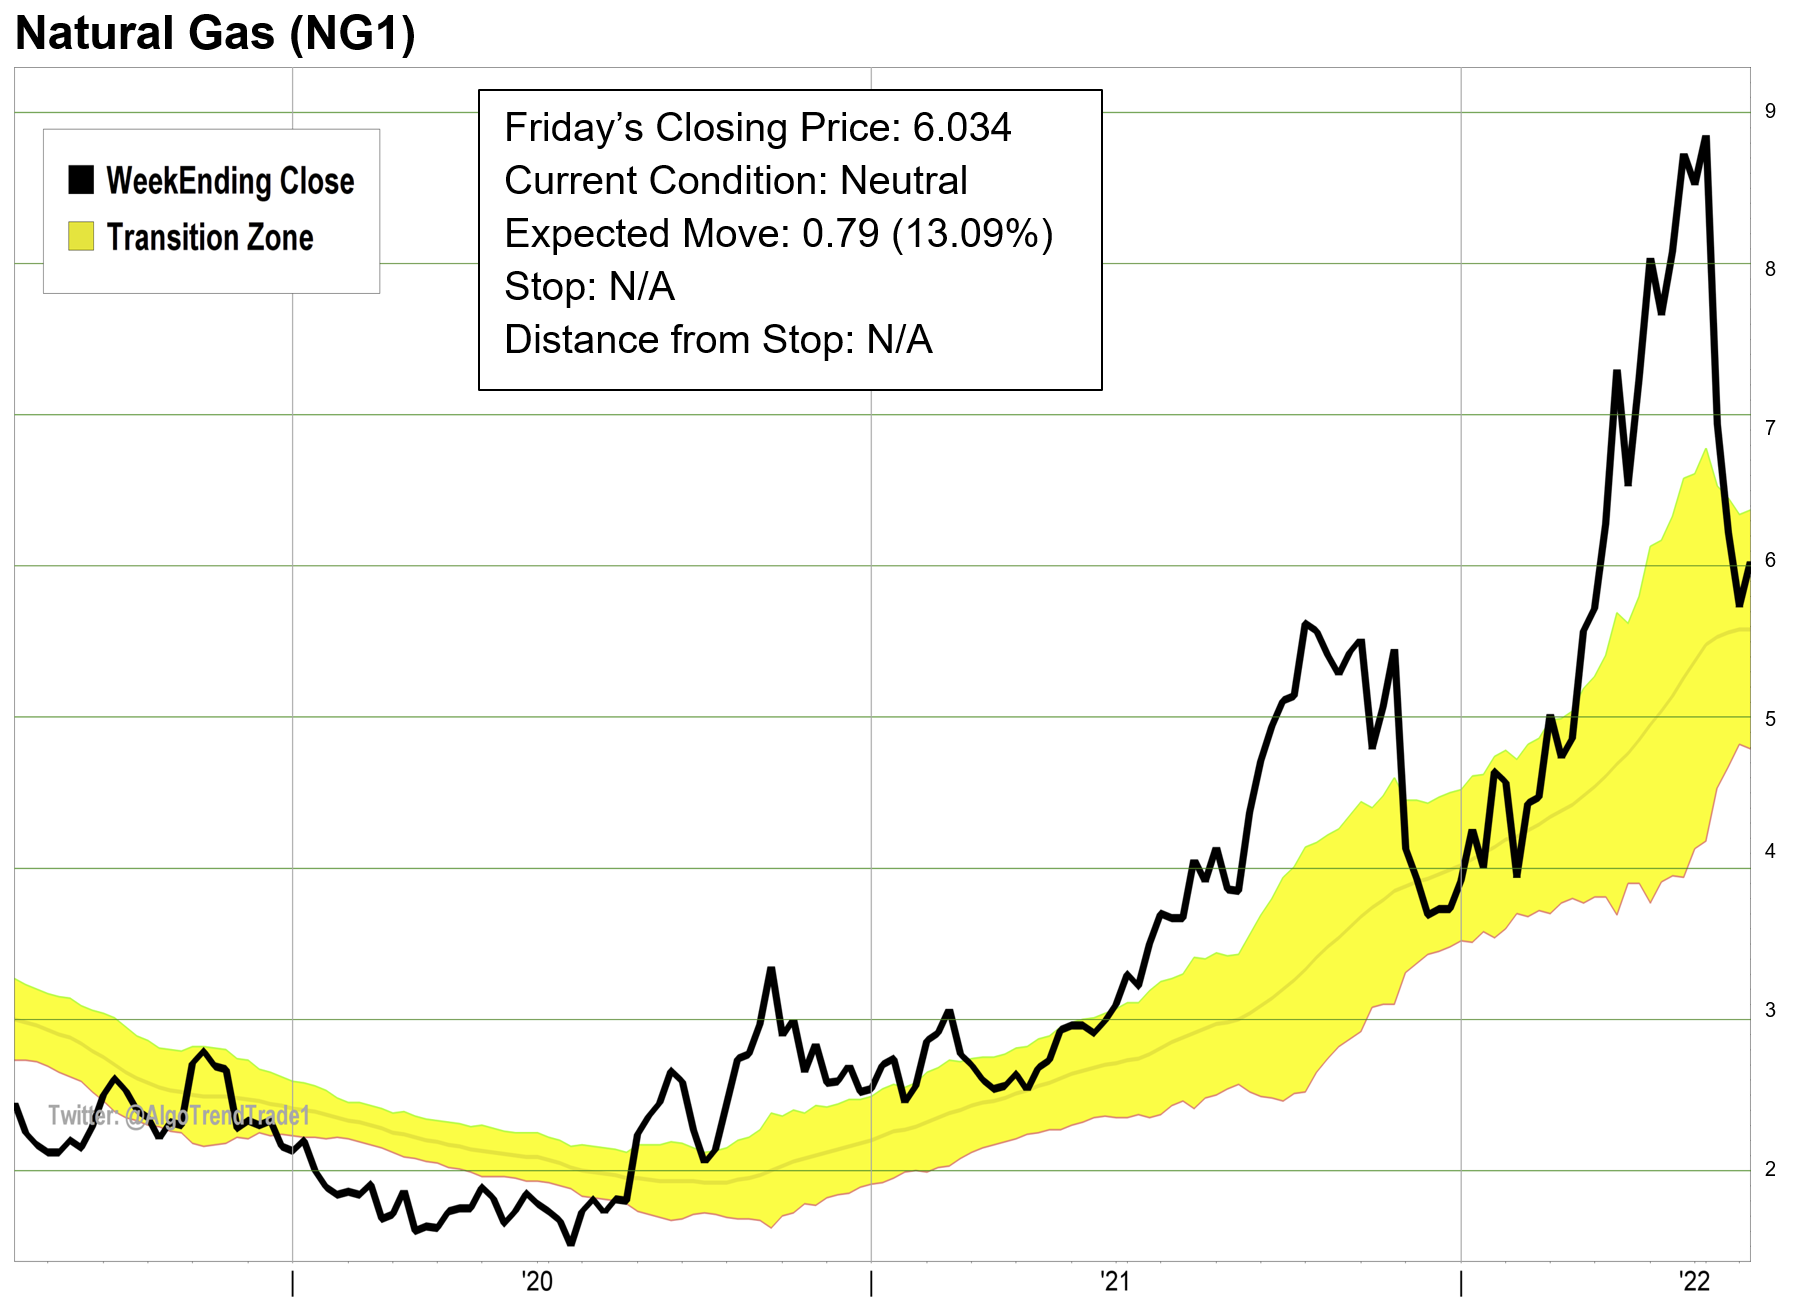
Natural Gas moved higher last week, but is inside the yellow channel Transition Zone (TZ) and remains in a Neutral condition. There is no trade this week in Natural Gas.
Gold closed lower again last week and closed below the TZ in a Bearish condition. The initial exit on the bearish trade is 1795.50 which is 1.1 Expected Moves (EM) from Friday’s closing price.
Silver closed lower again last week and remains in a Bearish condition. The current exit for the bearish trade is 22.28 which is 3.1 EM from Friday’s closing price.
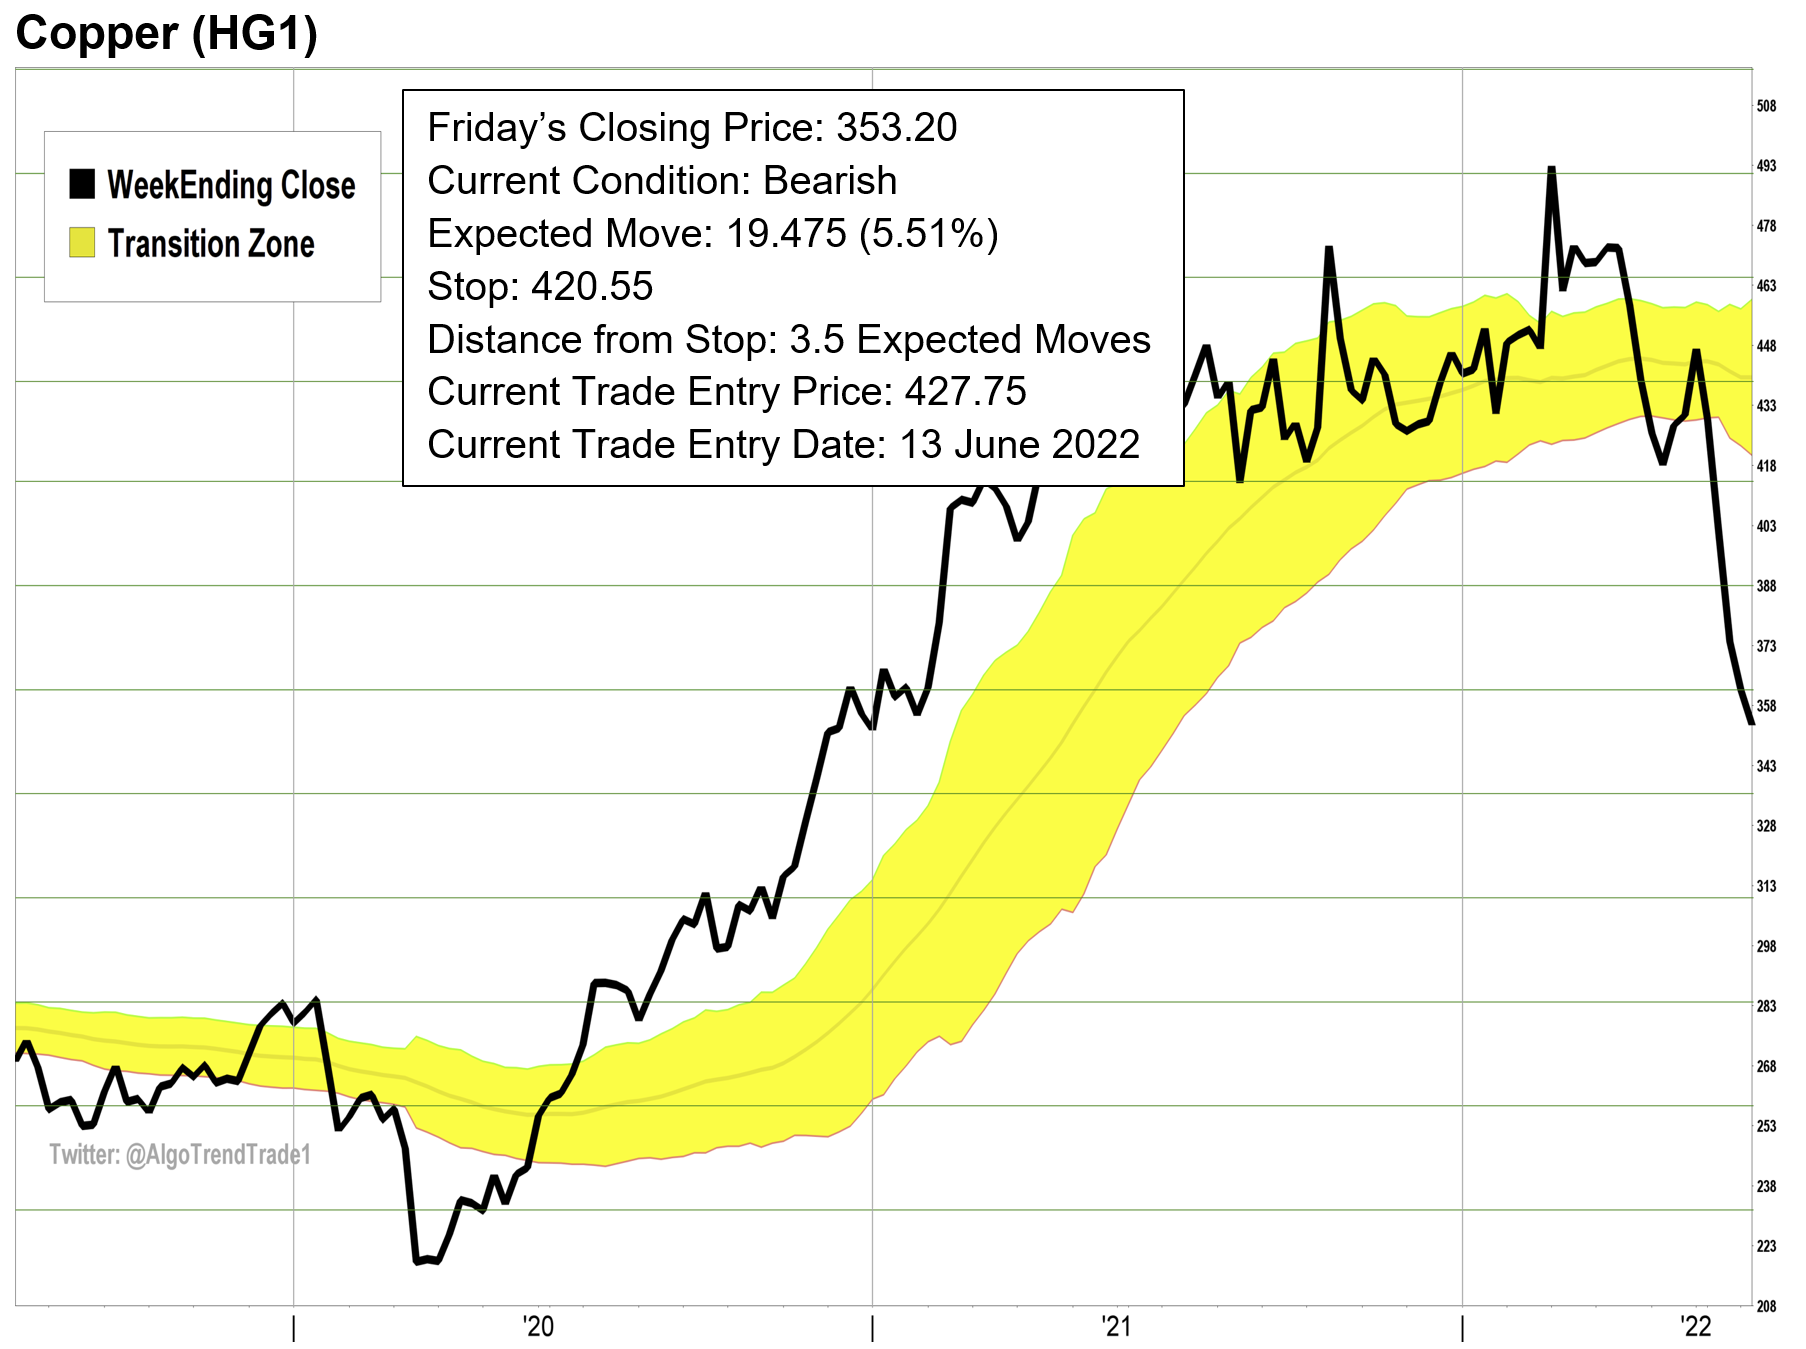
Copper also closed lower again last week and remains in a Bearish condition. The current exit on the bearish trade is 420.55 which is 3.5 EM from last week’s closing price.
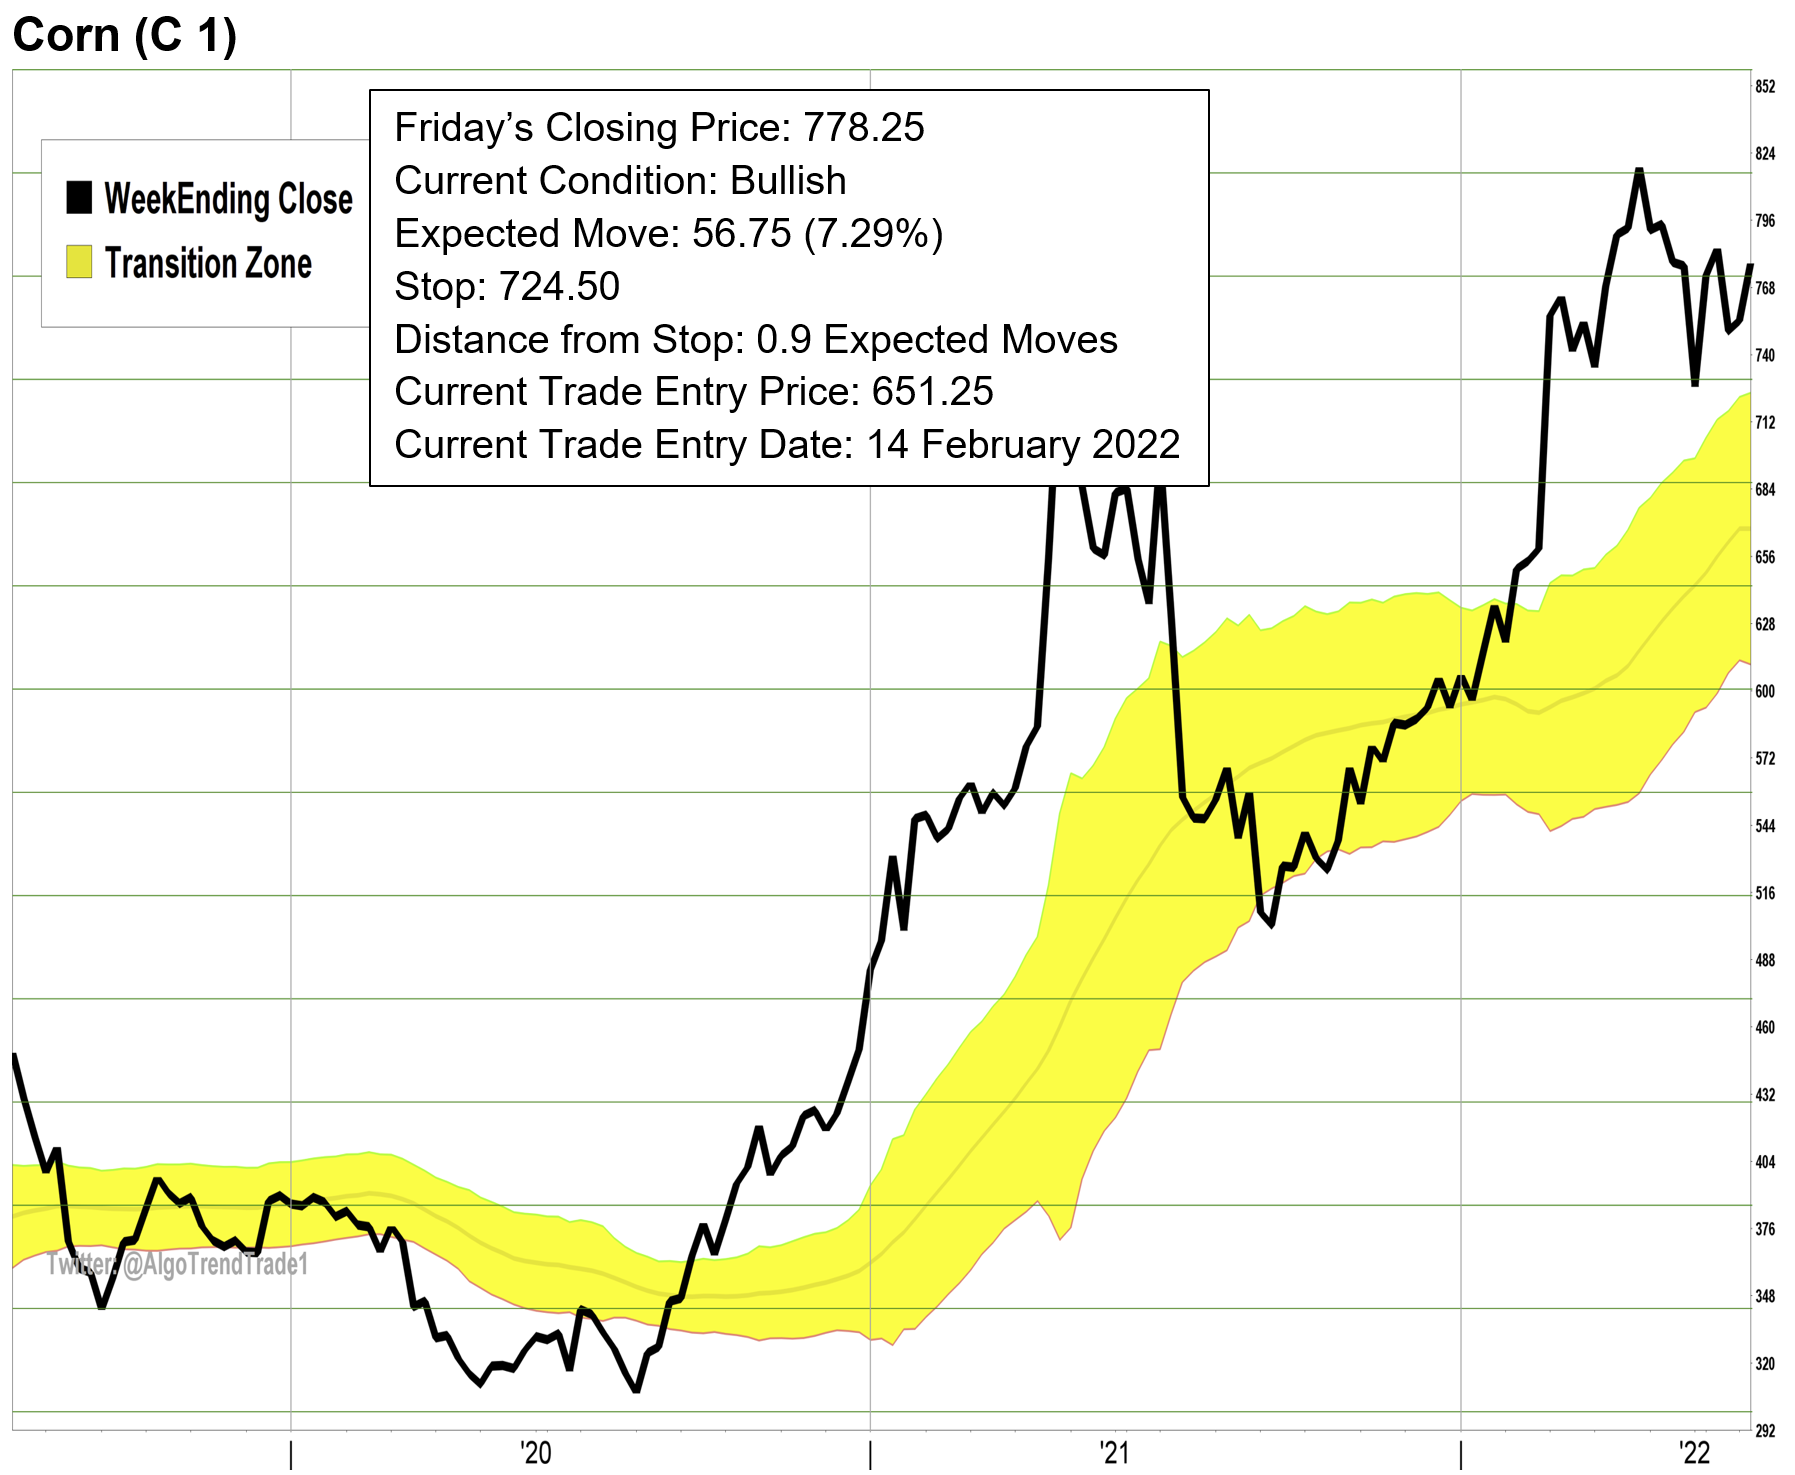
Corn moved very slightly higher last week and remains in a Bullish condition. The current exit on the bullish trade is 724.50 which is 0.9 EM from Friday’s close.
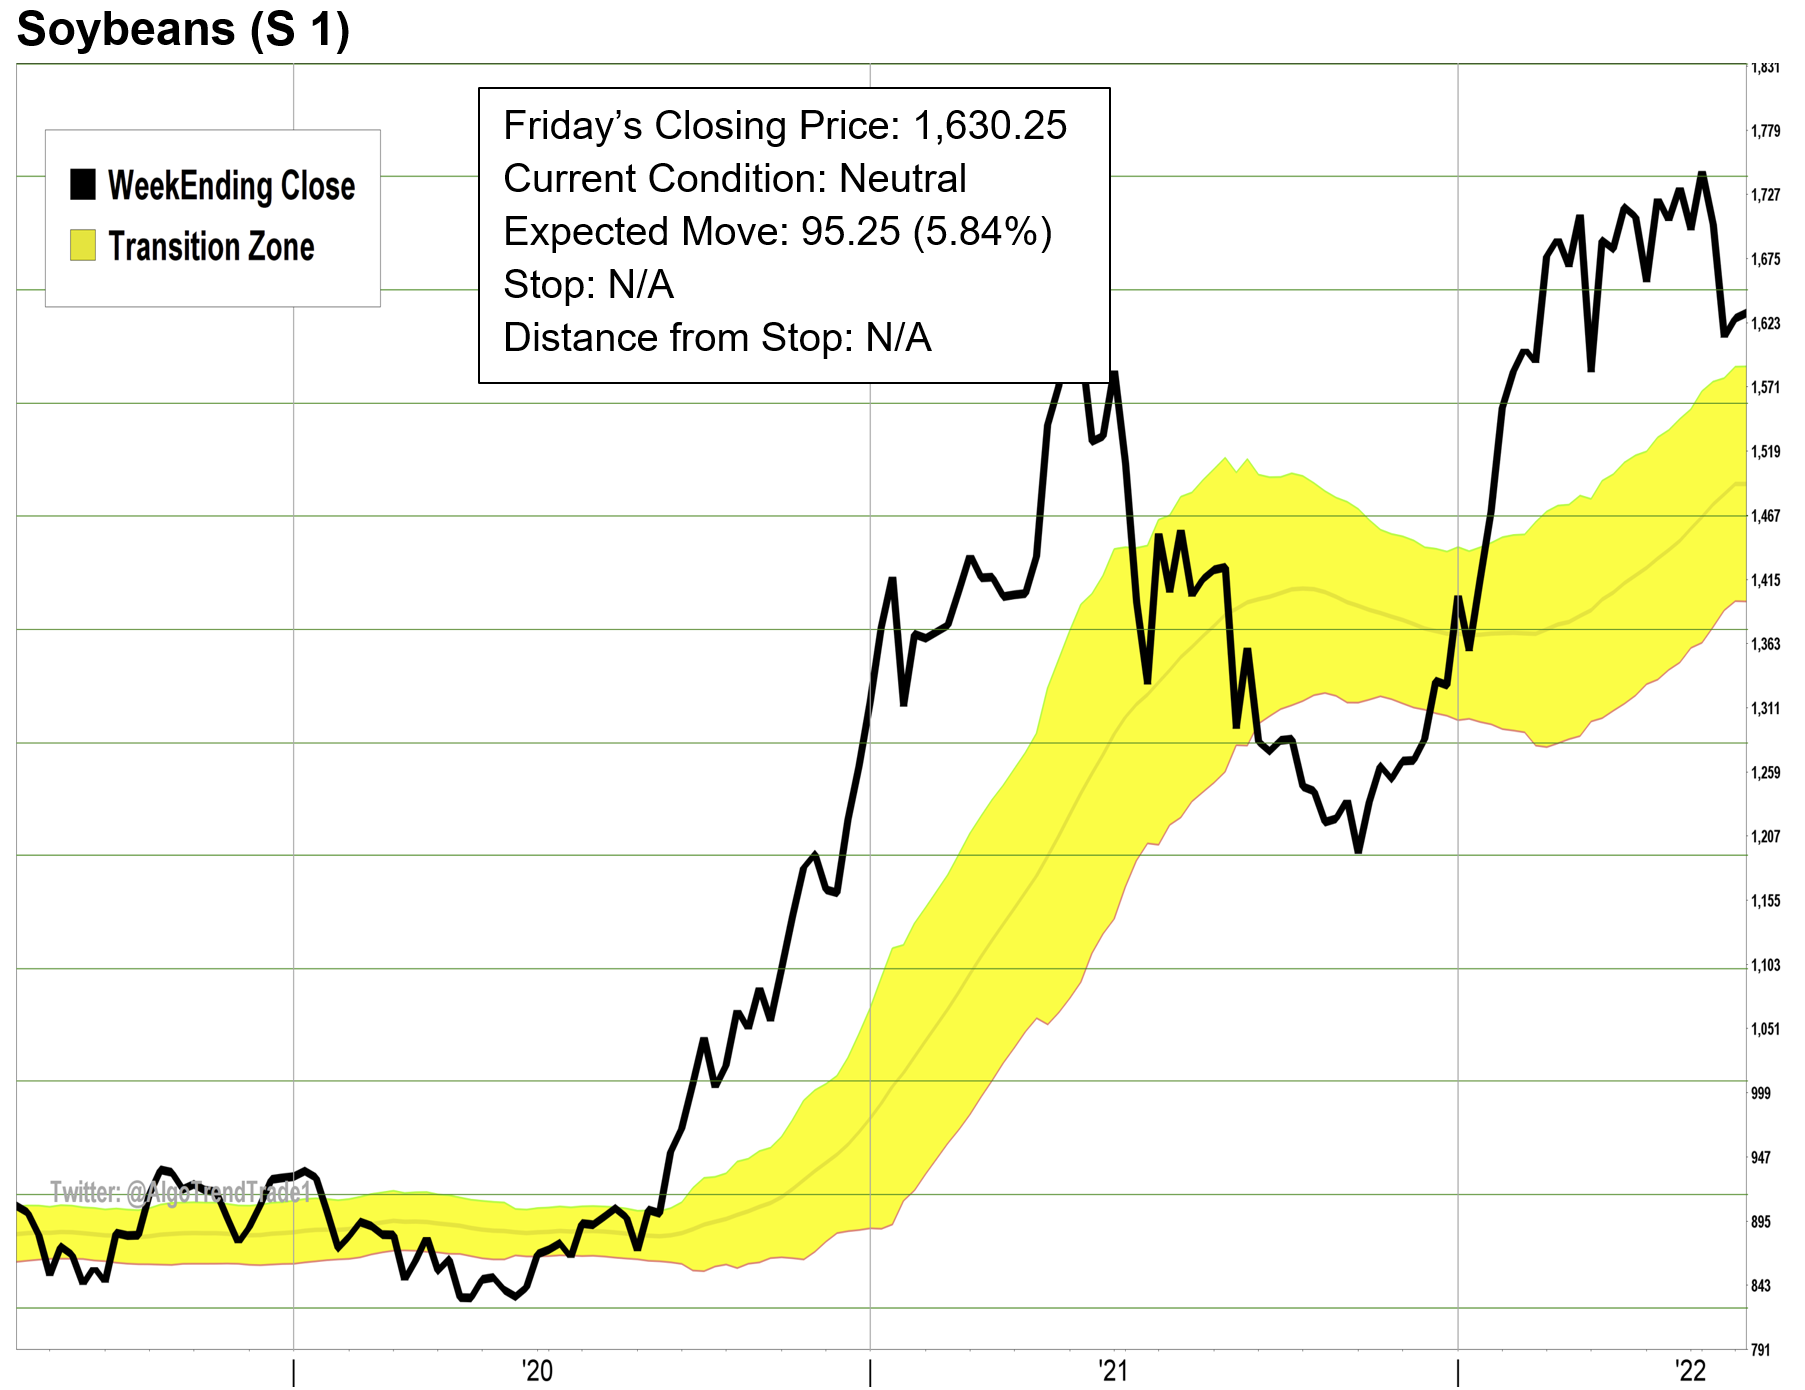
Soybeans moved higher last week, but hit its listed during trading. The bullish trade closed with a gain of 7.09%. Soybeans are now in a Neutral condition. There is no trade this week.
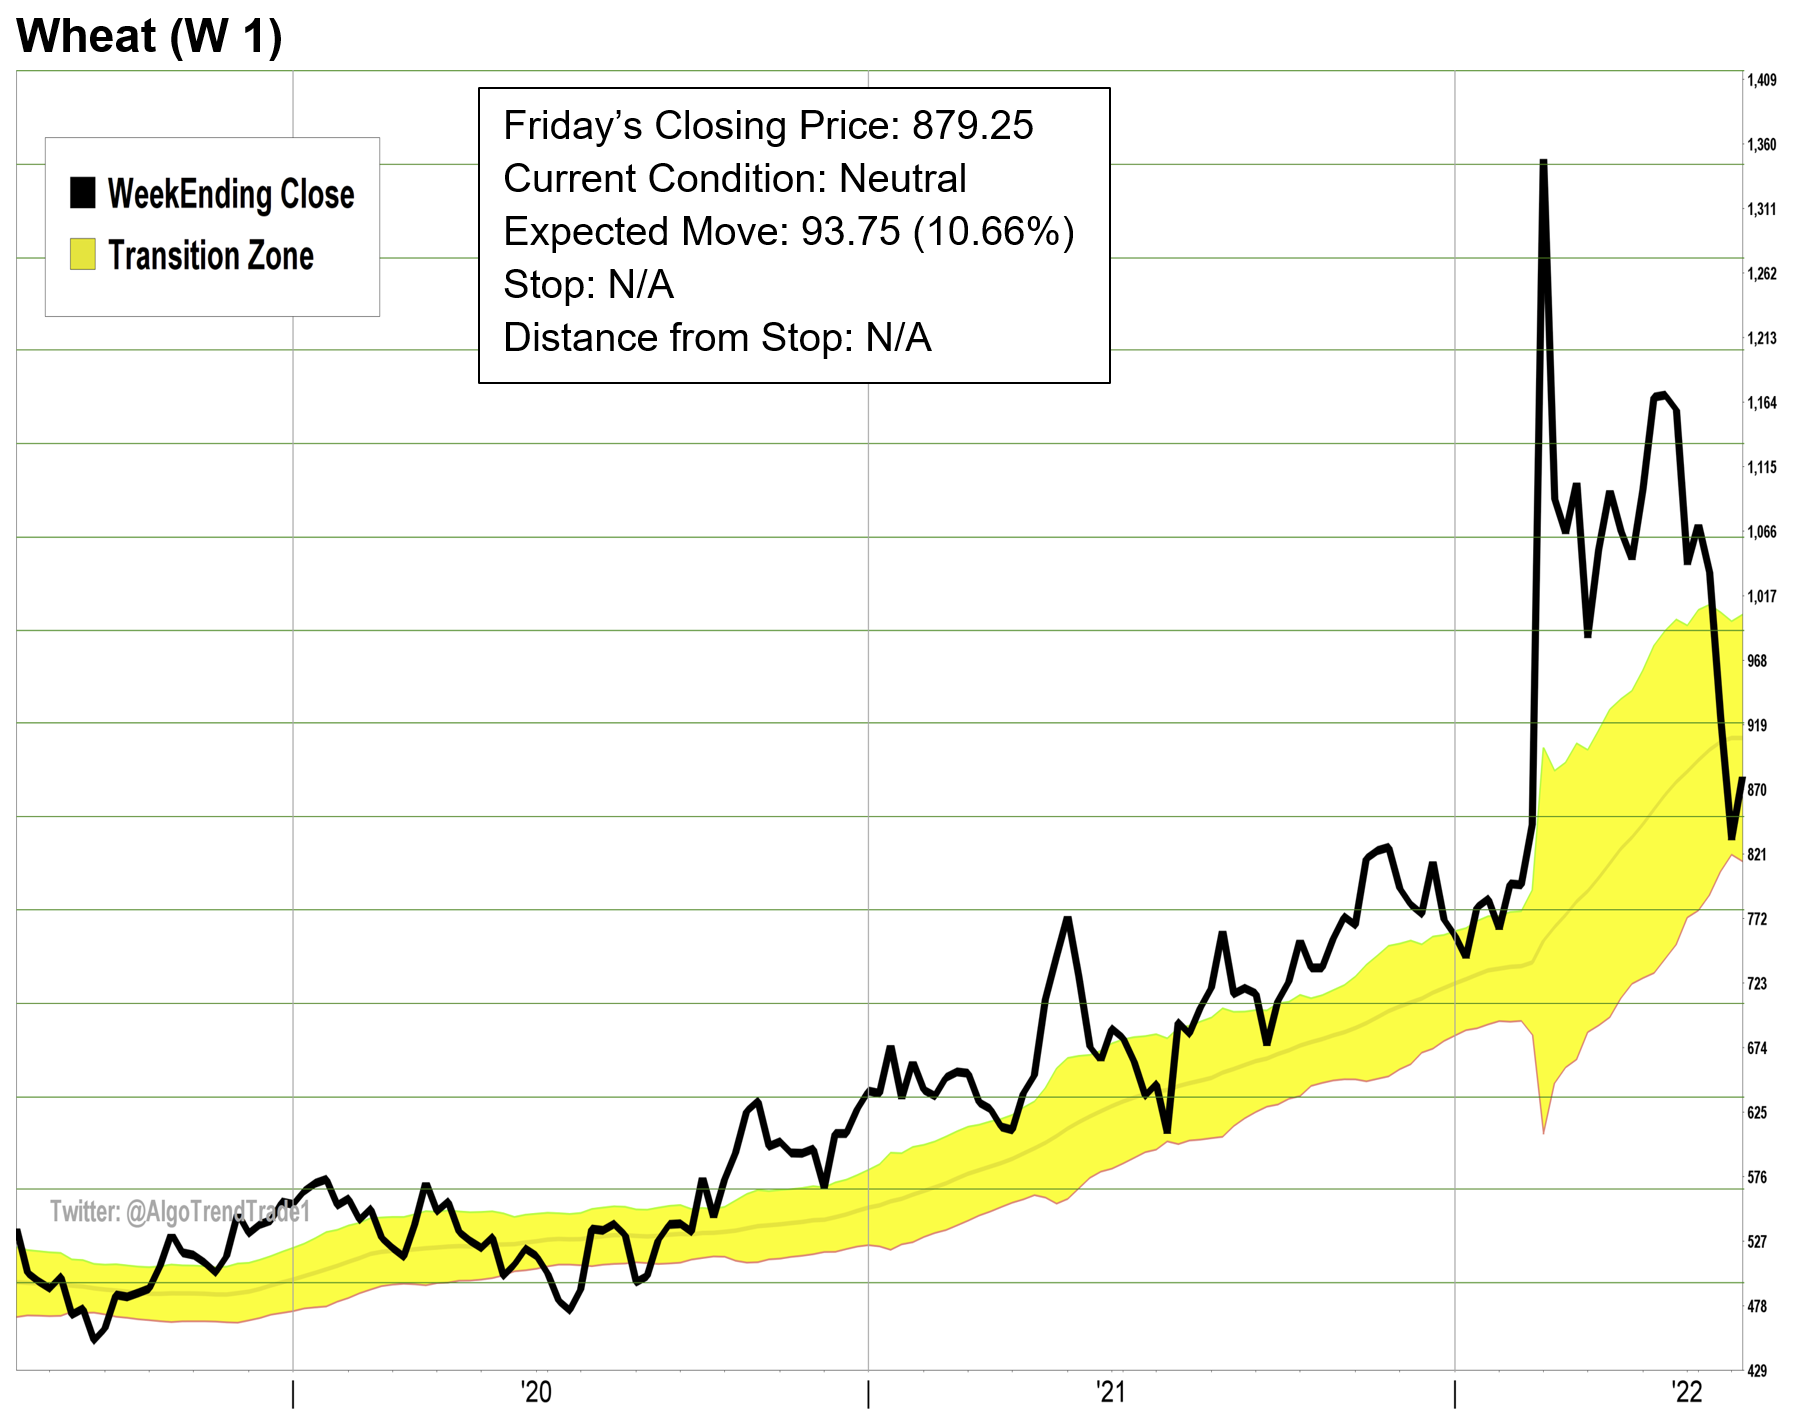
Wheat moved strongly higher last week, but it remains in the center of the TZ in a Neutral condition. There is no trade in Wheat this week.
Here are the latest charts…
Trend-Trading Overview
In this weekly report, we give you the trading signals for eight of the most liquid traded commodities. The signals are based on trend-following principles. Very simply, commodities, like stocks, stay in trends until they don’t. Trends can last a short time or they can last for months and even years at a time.
This is not a “get-rich-quick” scheme
If you’re looking to make a ton of money in a short time, you’re going to be disappointed. Trend-trading is not fancy; it’s boring, and takes time to be successful. This is a system that relies on a historically-proven process to generate solid returns on winning trades and avoid large losses on losing trades. We’re definitely the tortoise, not the hare.
Trend-following systems don’t try to guess what the next move in the markets might be. Instead, we measure the markets each week and use our algorithms to determine the current trend and the exit strategy for the current trades.
The key to the winning trades greatly outperforming the losing trades is the risk management system. If a trade moves against us, we’ll get out of the trade with a small loss. But if a trade trends higher for months at a time, we have the ability to build up substantial profits.
AlgoTrendTraders uses both trend and momentum to generate the trading signals. The yellow channel you see in the center of the charts is called the “Transition Zone”. When a commodity is above the yellow channel, it’s in a Bullish condition. When it’s below the yellow channel, it’s in a Bearish condition. When it’s in the middle of the channel, it’s in a Neutral condition and there is no trade.
Selling is More Important Than Buying
Every trade has a pre-determined exit strategy. This is based on the normal volatility of the underlying ticker. Each commodity has its own unique volatility. And volatility is dynamic. It’s constantly changing. Each week, we look at the previous 52 weeks of price movement to come up with its normal weekly volatility. This is called the “Expected Move”. The Expected Move equals one week of the normal volatility of the stock or ETF being measured. Every week, the exit strategy for each ticker is updated.
The system is based on the weekly closes of the underlying tickers. All trading information and volatility calculations are based on weekly volatility. By using weekly calculations, the system ignores the day-to-day noise in the markets and is able to give better signals.
It’s easy to see the periods of time that volatility increases and decreases. As the yellow channel Transition Zone widens on the charts, the volatility is increasing. The opposite is true; when the Transition Zone narrows on the charts, the volatility is decreasing.
The best time to enter a trade is when a new signal is given. This gives you the greatest opportunity to get into a trend that could last a long time. Though it’s possible to get into a trade after a trend has been in place for a while, the risk in that trade is elevated. Consider using 1/2 or 1/3 of your normal investment for these situations.
Commodity trading is for experienced investors who understand leverage and trading on margin. It’s possible to lose more than your initial investment even with a stop in place.
Disclaimer:
The information published in this newsletter should not be used to make personal investment decisions. We are not licensed by any federal or state entity to give investment advice. We do not know your personal financial situation. Investments should be made only after consulting with your professional investment advisor and only after reviewing the prospectuses or financial statements of the companies in which you’re considering investing.