
Thomas Meyer, Editor
January 30, 2023
Twitter: @AlgoTrendTrade1
Email: algotrendtraders@gmail.com
Welcome to this week’s AlgoTrendTraders report. Before we get into this week’s report, be sure to follow us on Twitter: @AlgoTrendTrade1
We’ll post updates throughout the week.
Welcome Back to AlgoTrendTraders
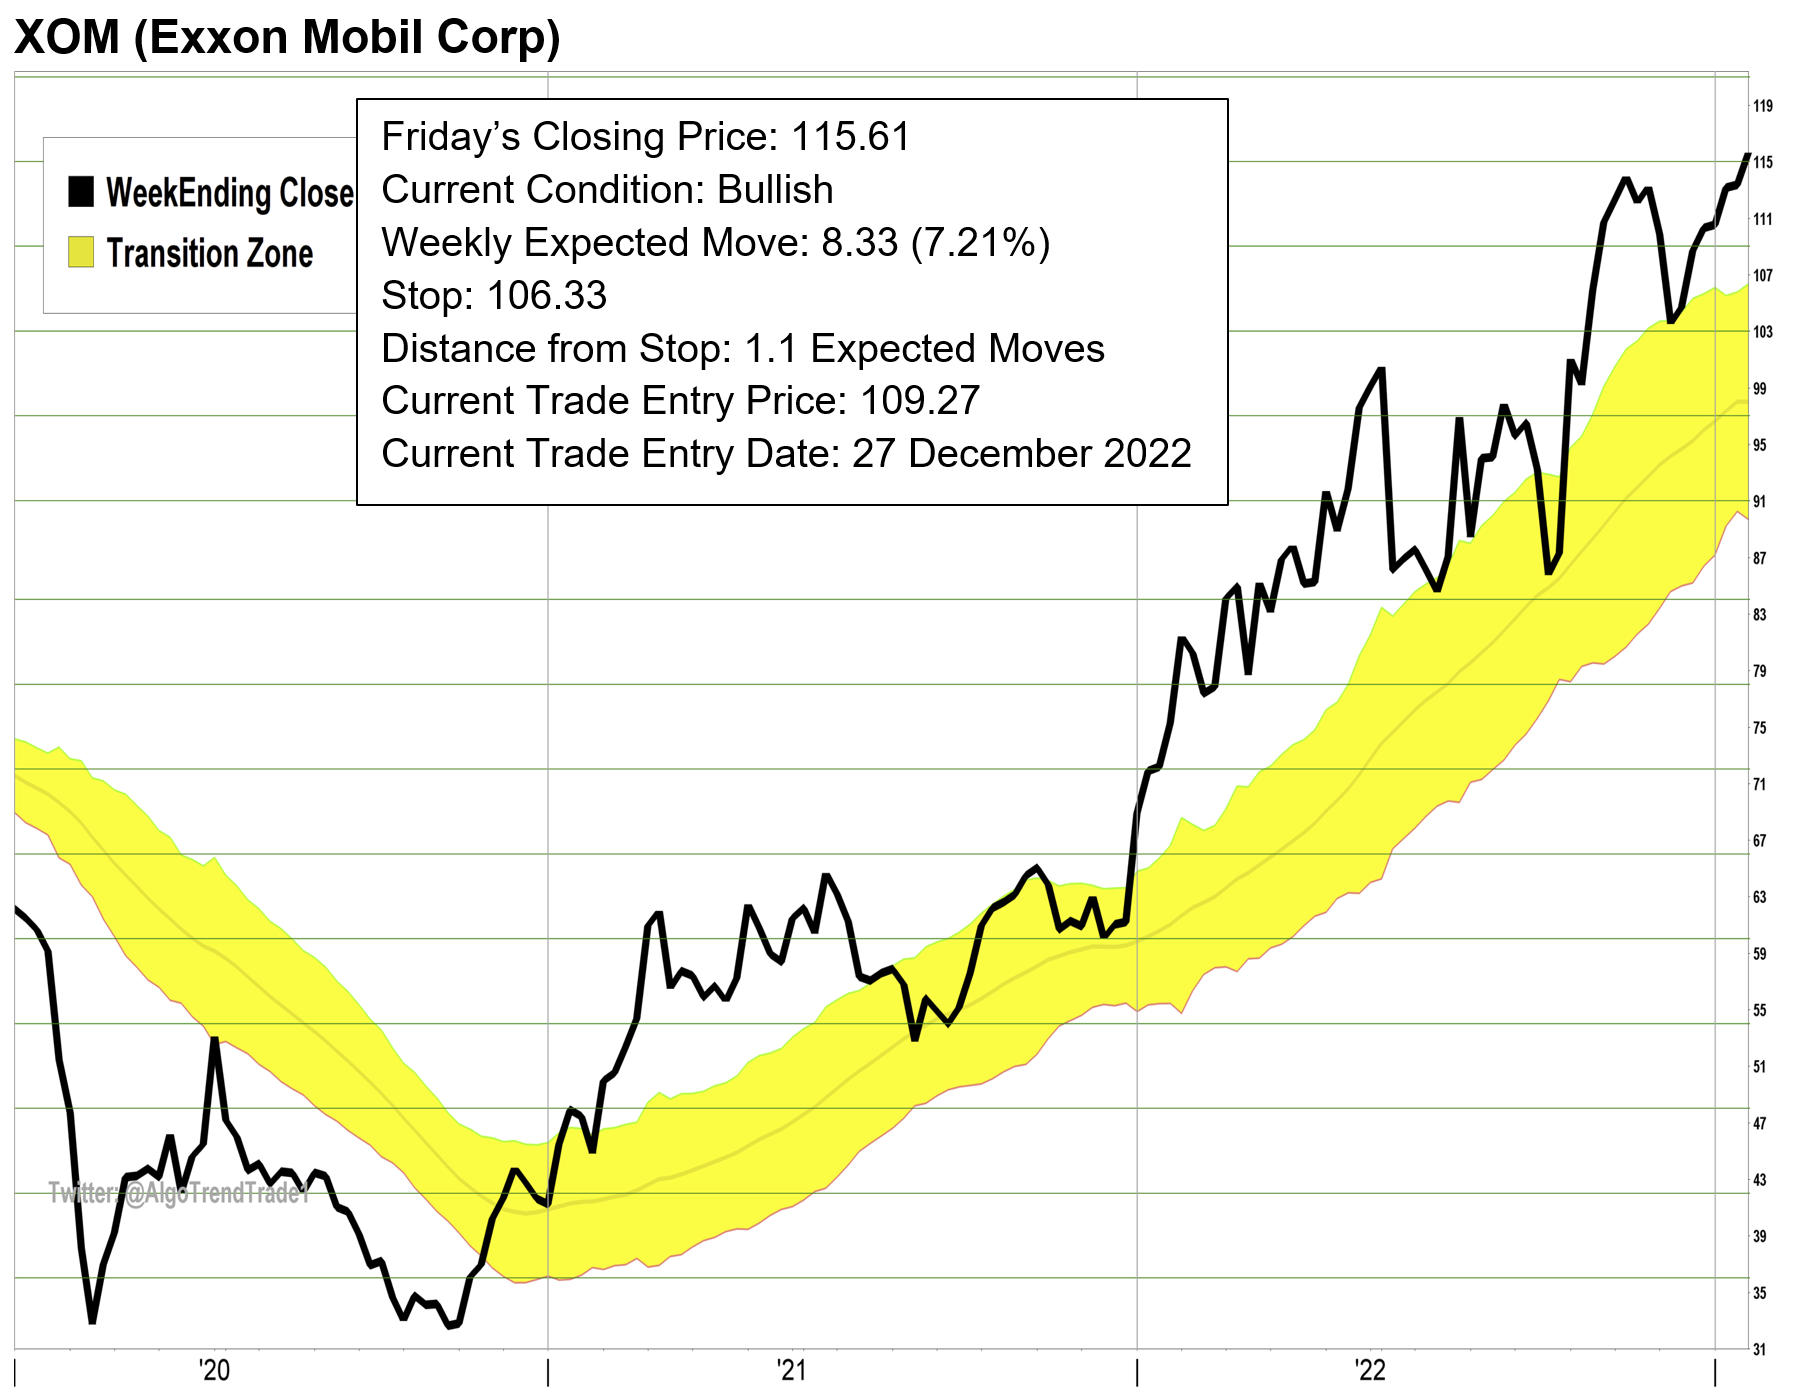
After a six month hiatus, we are returning to weekly publishing of the ATT report. We are continuing to follow the trading signals for SPY, QQQ, and GLD. We’re replacing the signals for ARKK and Bitcoin with signals for AAPL and XOM. These are two highly liquid tickers and in many of our readers’ portfolios.
Beginning next week, we’ll resume weekly publishing of the AlgoTrendTraders Weekly Commodity Report. If you find these reports valuable, it would be appreciated if you let your colleagues know about the report and sign up for it on Substack.
We Achieved Outstanding Results in the Past Year
We began publishing this newsletter more than a year ago. We had also been publishing in the UK and Australia before that. Here are the results of the SPY and QQQ trades since the system triggered entry signals in 2021 through the end of November last year. Keep in mind that these are prices only and don’t take into account commissions, taxes, and other expenses.
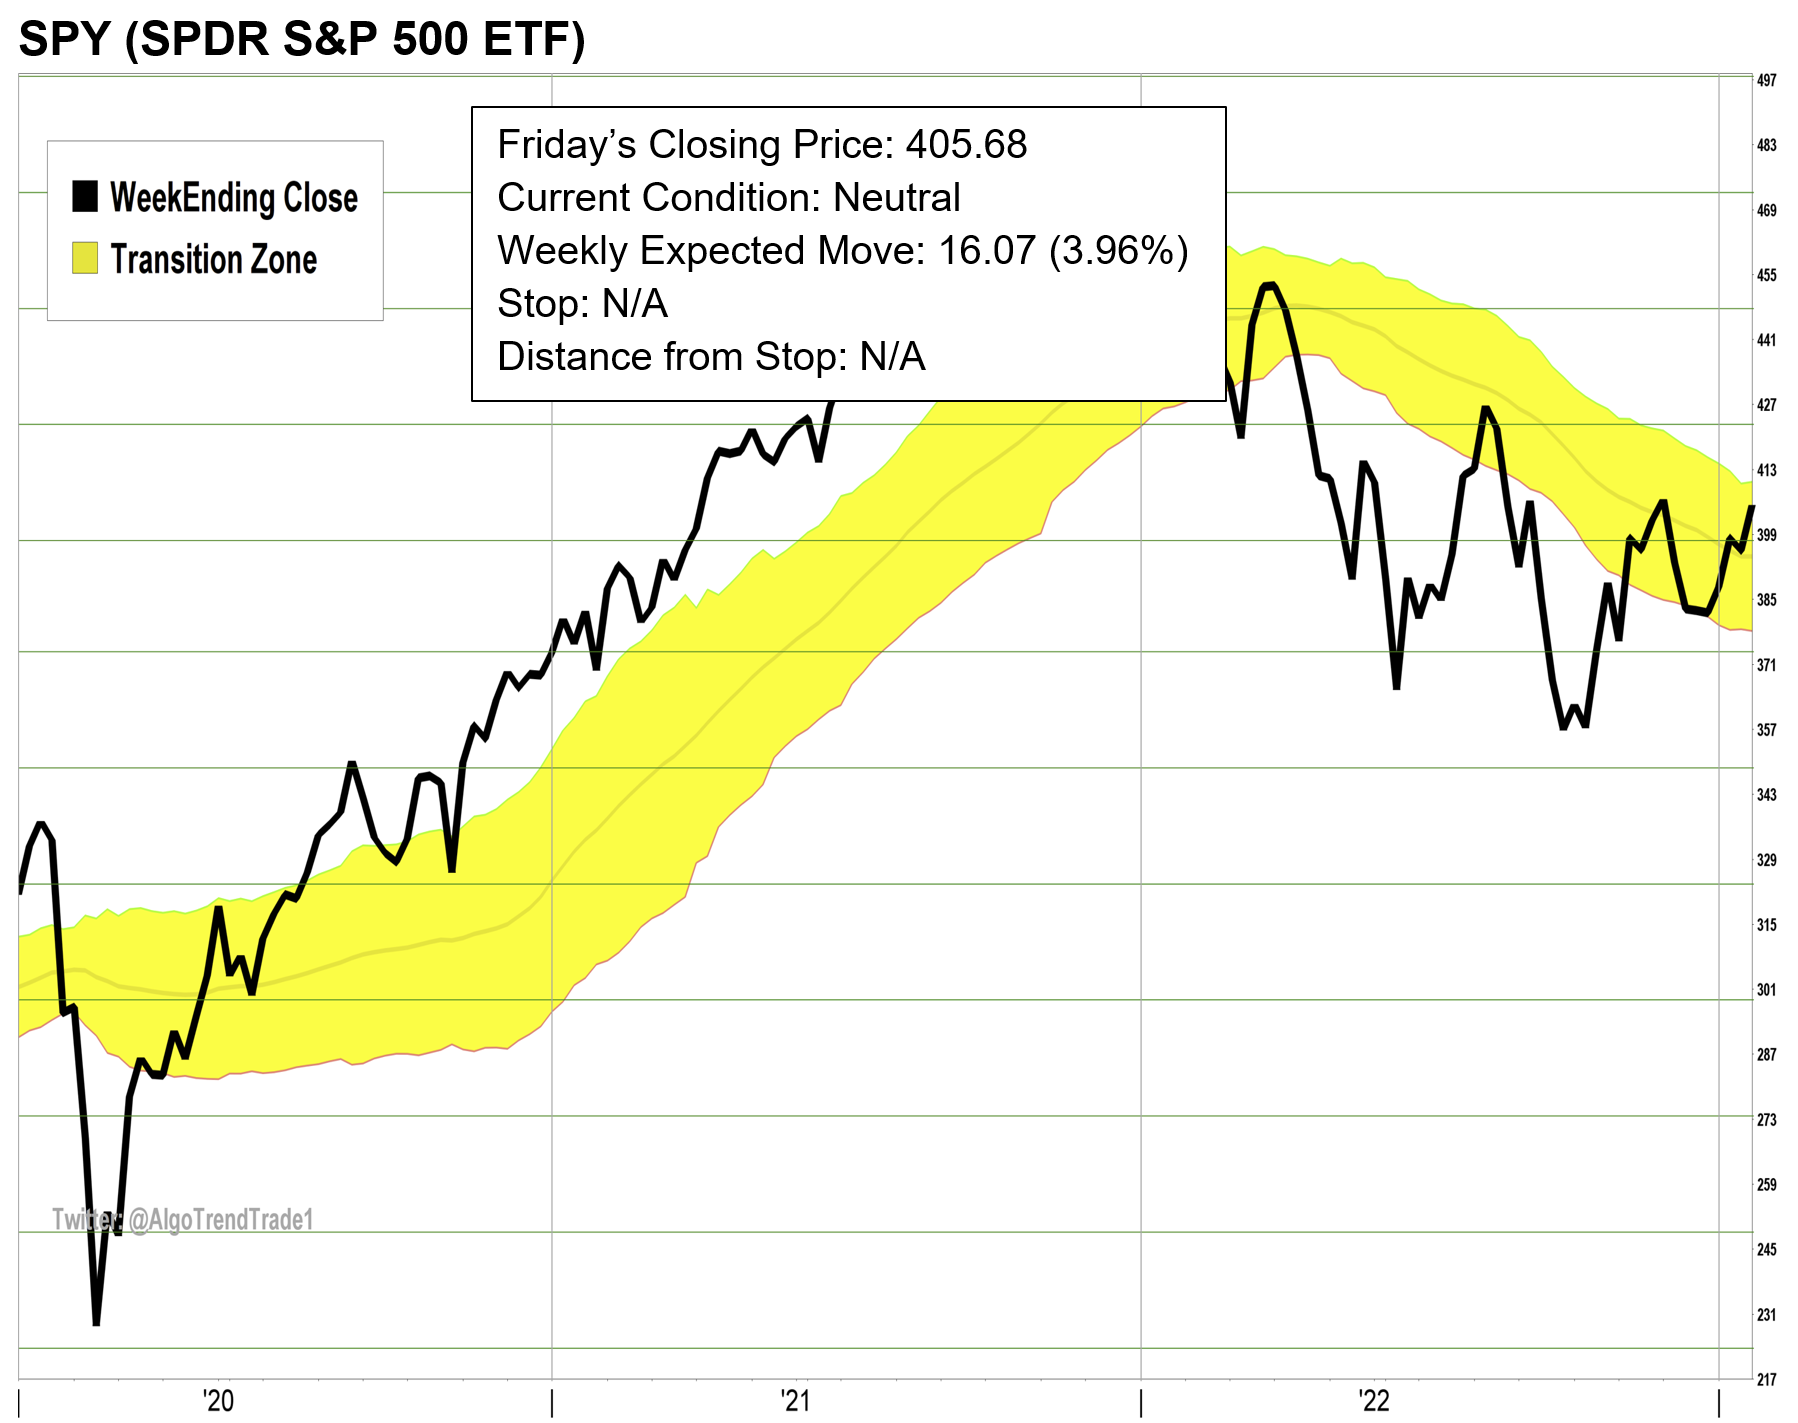
There were 6 trades in SPY, 4 were winning trades and 2 were losing trades. The average gain per trade was +3.12%. Just doing a little simple math, that’s a gain of more than +19% in the past 1+ year. Of course, this includes both bullish conditions and bearish conditions. The gain of SPY during that same timeframe was +5.47%. We outperformed the market with much less risk.

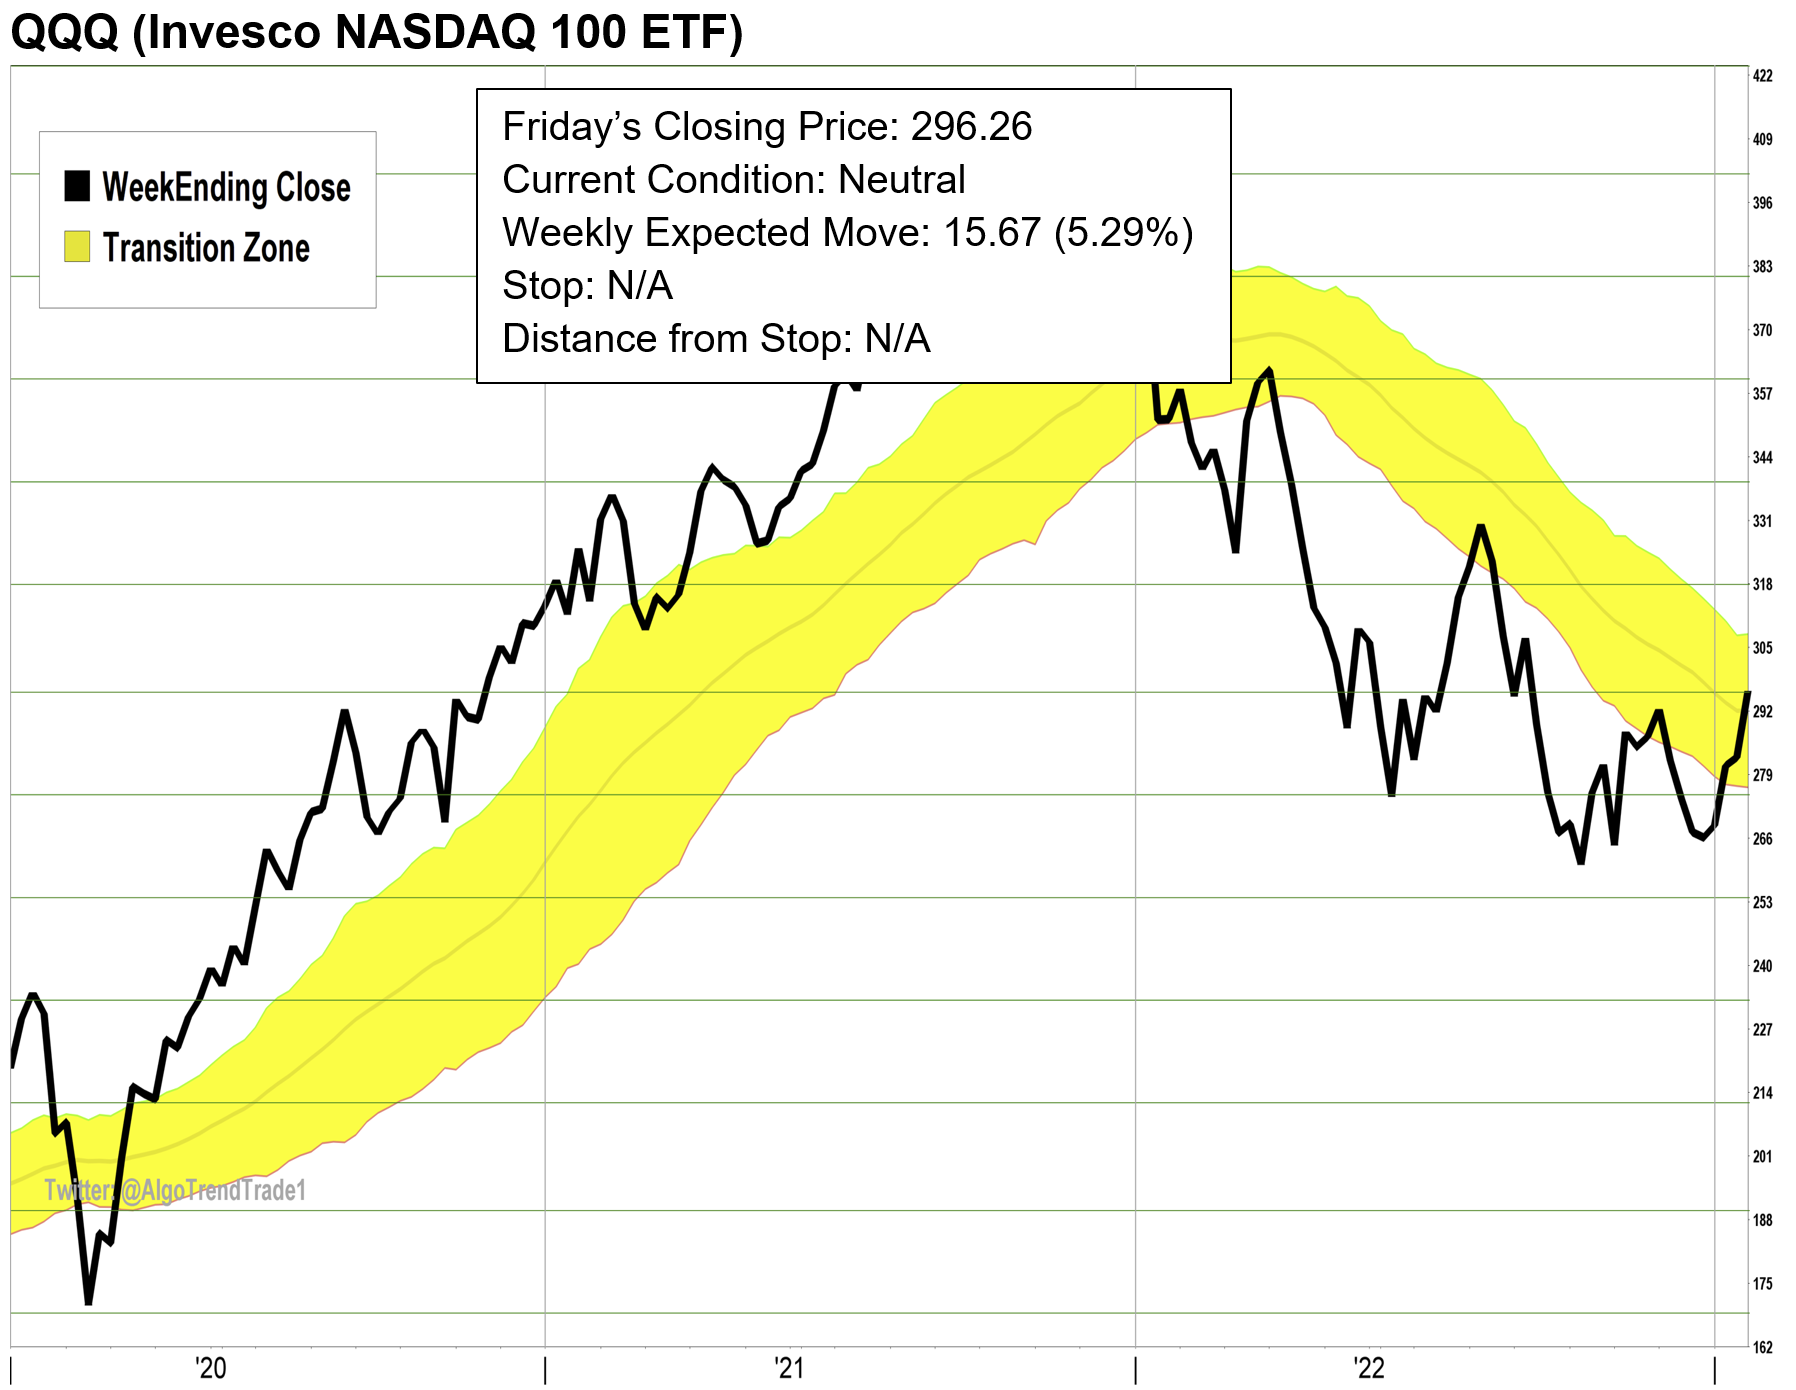
There was a similar outcome for QQQ. Of the 6 trades in the past year, 4 trades were winners and 2 trades were losers. The average gain per trade was +2.87%. That puts the total gain at almost +17% while QQQ actually fell -12.75% during the same timeframe. Again, we significantly outperformed the market with much less risk.

For those wanting to know more about Trend-Trading
The overview of the AlgoTrendTraders system is underneath the charts. Those familiar with our methodology can get right to the trades. If you’re new to trend-trading, be sure to read this introductory section. This will help you understand the concept of trend-trading and why it is so powerful.
Always have your exit strategies prepared before you enter into any trade.
The Composite Table for January 30, 2023

Be Sure to Read the Disclaimer at the End of This Report
Here are the latest charts…


Trend-Trading Overview
The long/short signals are based on trend-following principles. Very simply, stocks and commodities stay in trends… until they don’t. Trends can last a short time or they can last for months and even years at a time.
This is not a “get-rich-quick” scheme
If you’re looking to make a ton of money in a short time, you’re going to be disappointed. Trend-trading is not fancy; it’s boring, and takes time to be successful. This is a system that relies on a historically proven process to generate solid returns on winning trades and avoid large losses on losing trades. We’re definitely the tortoise, not the hare.
Trend-following systems don’t try to guess what the next move in the markets might be. Instead, we measure the markets each week and use our algorithms to determine the current trend and the exit strategy for the current trades.
The key to the winning trades greatly outperforming the losing trades is the risk management system. If a trade moves against us, we’ll get out of the trade with a small loss. But if a trade trends higher for months at a time, we have the ability to build up substantial profits.
AlgoTrendTraders uses both trend and momentum to generate the trading signals. The yellow channel you see in the center of the charts is called the “Transition Zone”. When a stock is above the yellow channel, it’s in a Bullish condition. When it’s below the yellow channel, it’s in a Bearish condition. When it’s in the middle of the channel, it’s in a Neutral condition and there is no trade.
Selling is More Important Than Buying
Every trade has a pre-determined exit strategy. This is based on the normal volatility of the underlying ticker. Each stock has its own unique volatility. And, volatility is dynamic. It’s constantly changing. Each week, we look at the previous 52 weeks of price movement to come up with its normal weekly volatility. This is called the “Expected Move”. The Expected Move equals one week of the normal volatility of the stock or ETF being measured. Every week, the exit strategy for each ticker is updated.
The system is based on the weekly closes of the underlying tickers. All trading information and volatility calculations are based on weekly volatility. By using weekly calculations, the system ignores the day-to-day noise in the markets and is able to give better signals.
It’s easy to see the periods of time that volatility increases and decreases. As the yellow channel Transition Zone widens on the charts, the volatility is increasing. The opposite is true; when the Transition Zone narrows on the charts, the volatility is decreasing.
The best time to enter a trade is when a new signal is given. This gives you the greatest opportunity to get into a trend that could last a long time. Though it’s possible to get into a trade after a trend has been in place for a while, the risk in that trade is elevated. Consider using 1/2 or 1/3 of your normal investment for these situations.
This report gives signals that can be followed by both novice and more experienced investors. Novice investors can use these signals to help them manage their 401(k) and retirement plans by adjusting the signals for SPY and QQQ to match the mutual funds in their plans. Though you won’t be able to short these indices when they become bearish, you can move to cash and avoid the devastating losses from bear markets.
Experienced and sophisticated investors can use leverage or options, but the risk is substantially greater. Never risk more money than you can afford to lose.
Disclaimer:
The information published in this newsletter should not be used to make personal investment decisions. We are not licensed by any federal or state entity to give investment advice. We do not know your personal financial situation. Investments should be made only after consulting with your professional investment advisor and only after reviewing the prospectuses or financial statements of the companies in which you’re considering investing.