
Thomas Meyer, Editor
January 3, 2022
Twitter: @AlgoTrendTrade1
Email: algotrendtraders@gmail.com
Welcome to this week’s AlgoTrendTraders report. Before we get into this week’s report, be sure to follow us on Twitter. We’ll post updates throughout the week on these trades and others exclusively on Twitter.
Happy New Year!
We ended 2021 with 3 trades in place, all of which are likely to be profitable even if they move against us. What’s going to happen in 2022? Of course, nobody knows. That’s why we measure the market each week, identify the trends that are in place, and manage our trades according to the discipline built into this system.
This report is getting new subscribers each week. We have novice investors, sophisticated traders, and everything in between. For those less experienced, please feel free to email any questions you have. It’s ok if you don’t know the answer. If you don’t understand something, it’s likely that someone else doesn’t understand it either. We’ll answer some of these as they come in each week.
The Weekly Commodity Report will be sent out later today. Commodity trading is normally for more experienced investors; however, novice investors can continue to learn more about trend-trading by reading the report and learning about the commodity markets. This report is free for now, but will become a paid subscription beginning in January 2022.
The information in this report is very valuable. Please share this newsletter with your friends and colleagues who can also benefit from an intelligent, disciplined, rules-based trading system. And if you have a question, feel free to send an email. We’ll be glad to clarify anything that’s not clear in the reports.
The Santa Claus Rally Closed Out 2021
The markets continued the mid-December rally and closed higher to end the year. The S&P 500 had a new all-time weekly close. The Nasdaq 100 closed less than 2% from its all-time weekly close. Will the markets continue moving higher? We don’t know so that’s why we have exit strategies in place.
In summary, there are currently 2 bullish trades and 1 bearish trade in place. Be sure your exit strategies for these trades are updated early in the week.
For those wanting to know more about Trend-Trading
The overview of the AlgoTrendTraders system is underneath the charts. Those familiar with our methodology can get right to the trades. If you’re new to trend-trading, be sure to read this introductory section. This will help you understand the concept of trend-trading and why it’s so powerful.
Each week, we show you the Composite Table that has the week-ending price, current volatility, and the updated exit strategy for each of the ETFs and Bitcoin. We repeat this a lot because it’s the most important element for successful investing…
Always have your exit strategies prepared before you enter into any trade.
The Composite Table for January 3, 2022

SPY (S&P 500 ETF) ended 2021 at a new all-time weekly closing high. SPY remains in a Bullish condition. The listed stop for the trade moved up to 454.79 which is 1.1 Expected Moves (EM) from Friday’s closing price.
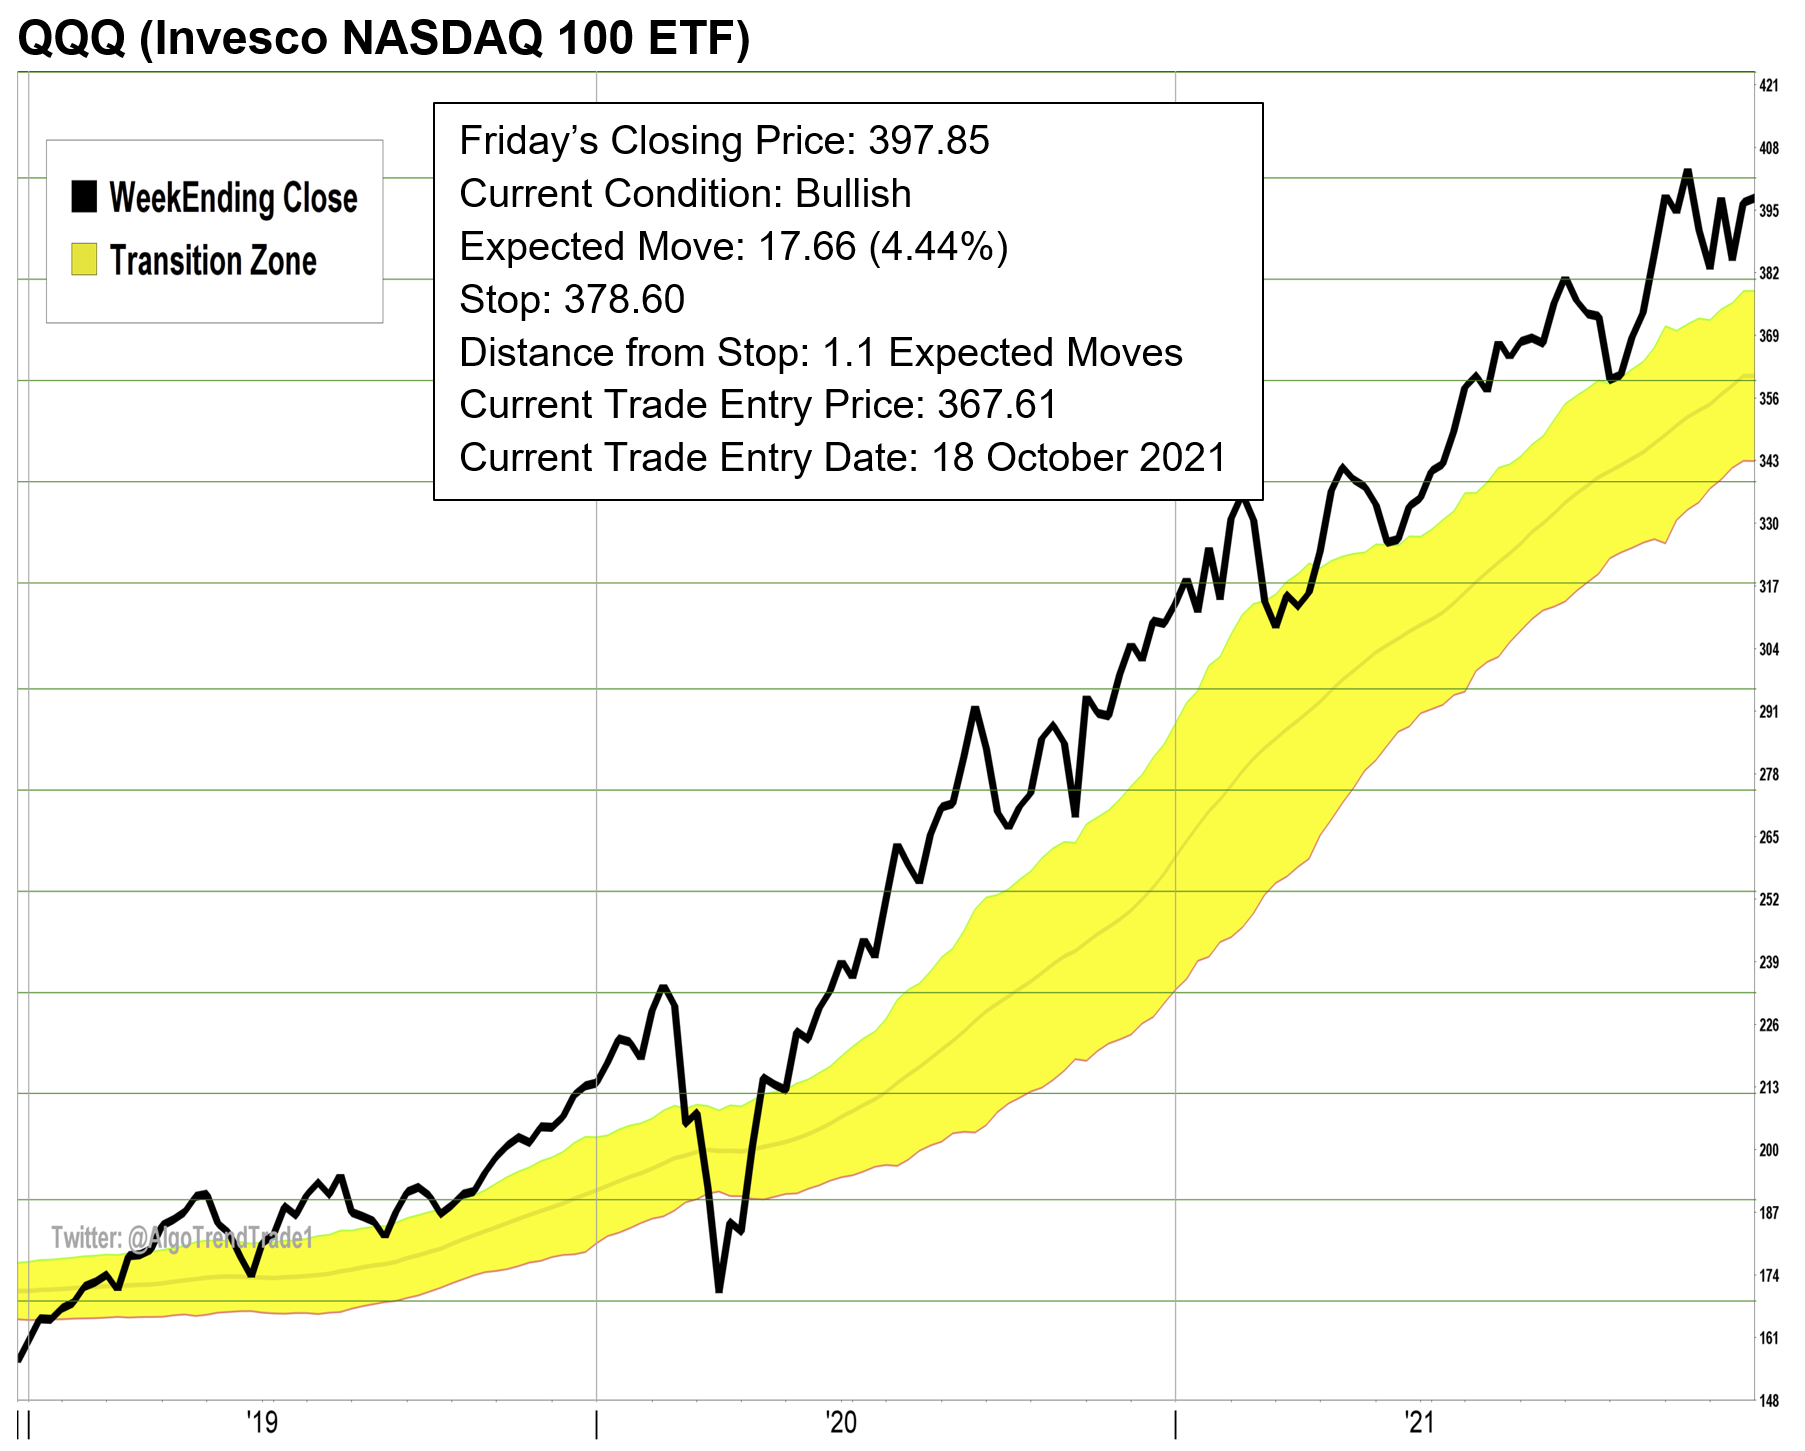
QQQ (Nasdaq 100 ETF) closed the week less than 2% from its all-time high. It remains in a Bullish condition. The listed stop moved up to 378.60 which is 1.1 EM from the weekly closing price.
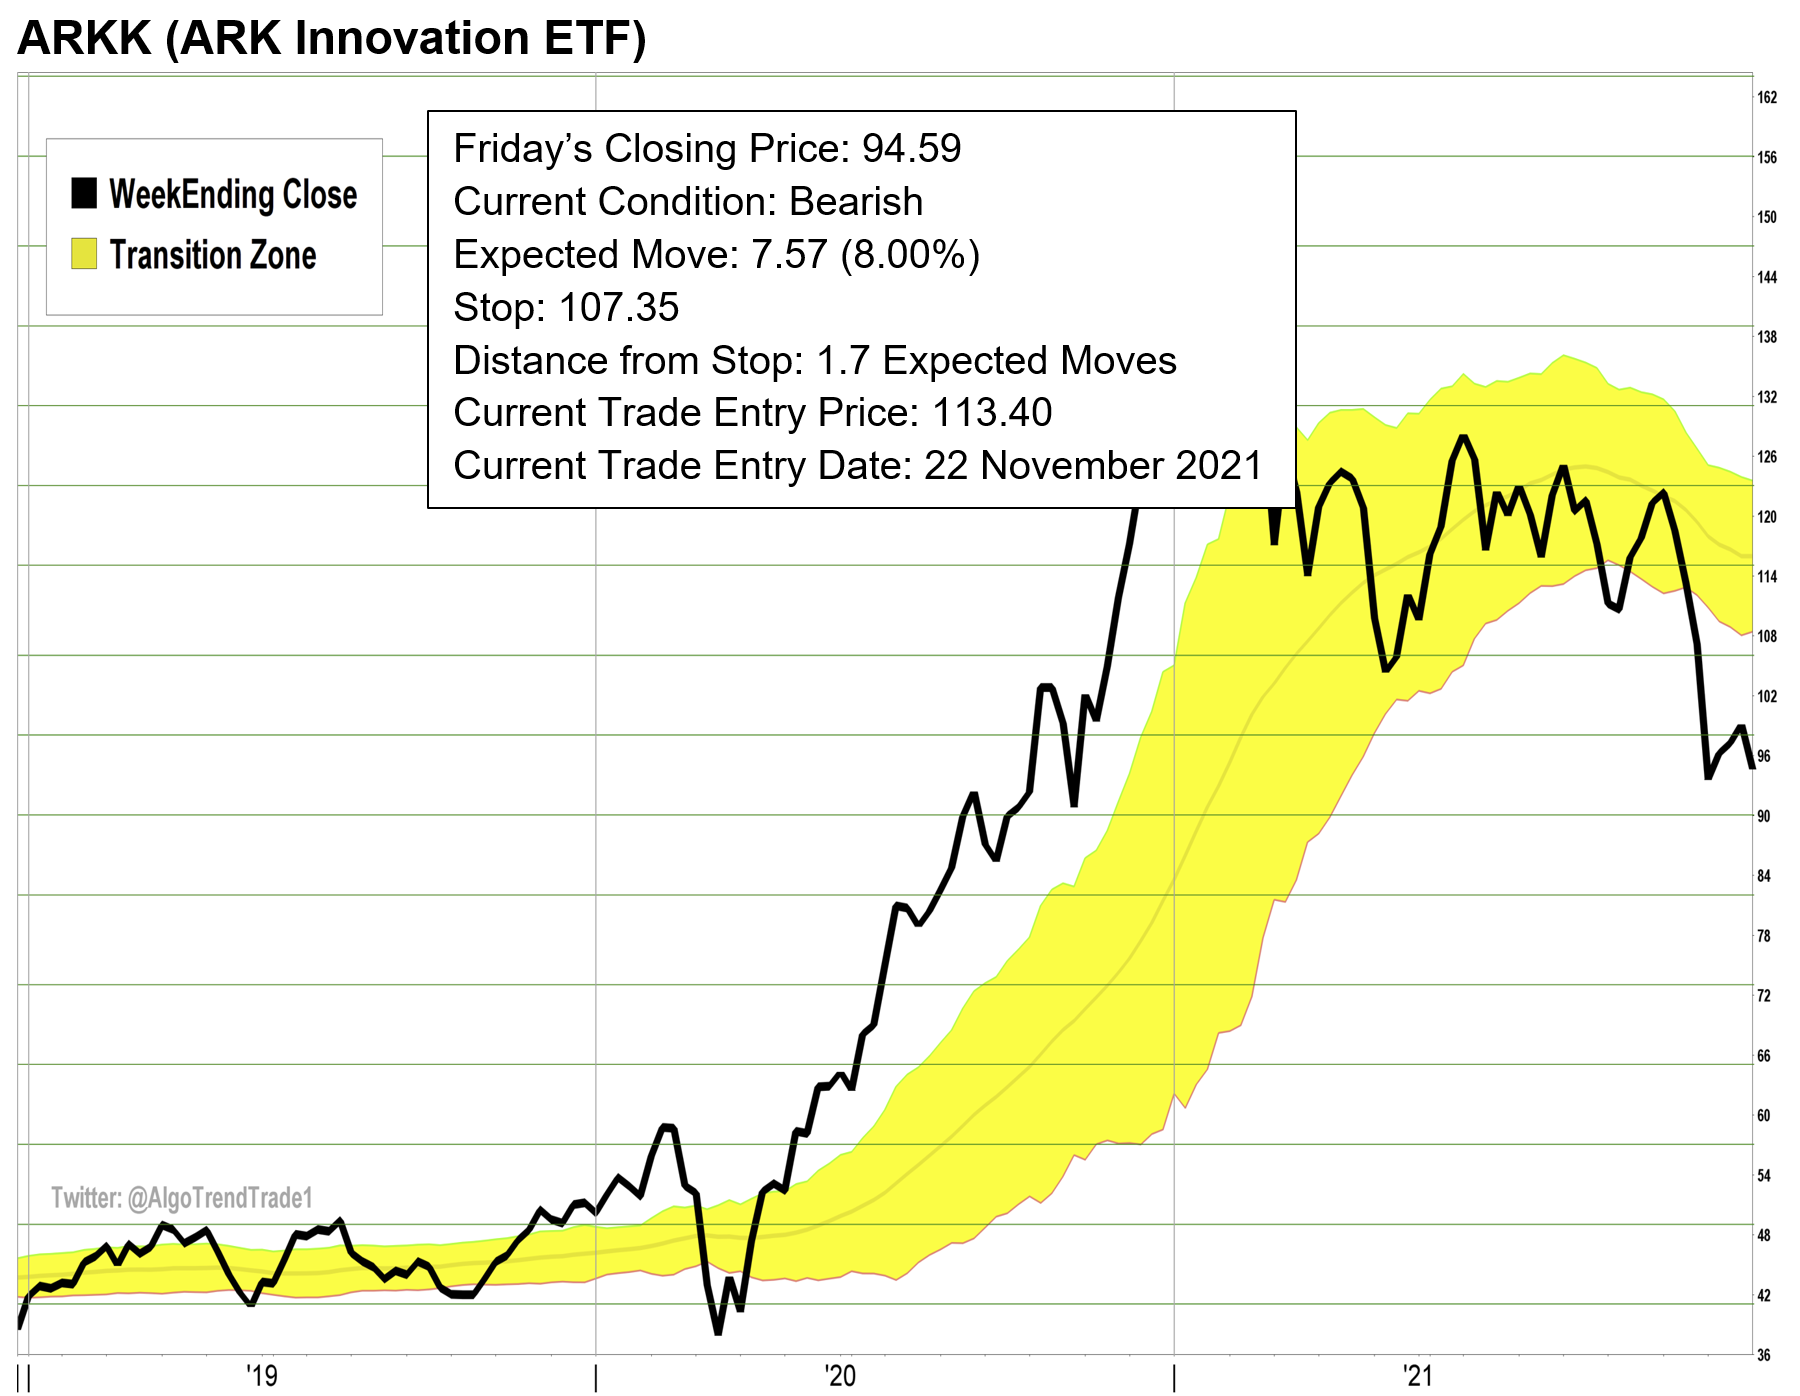
ARKK (Ark Innovation ETF) closed lower for the first time in four weeks and it remains in a Bearish condition. The current listed stop for the bearish trade dropped down to 107.35 which is 1.7 EM from Friday’s closing price.
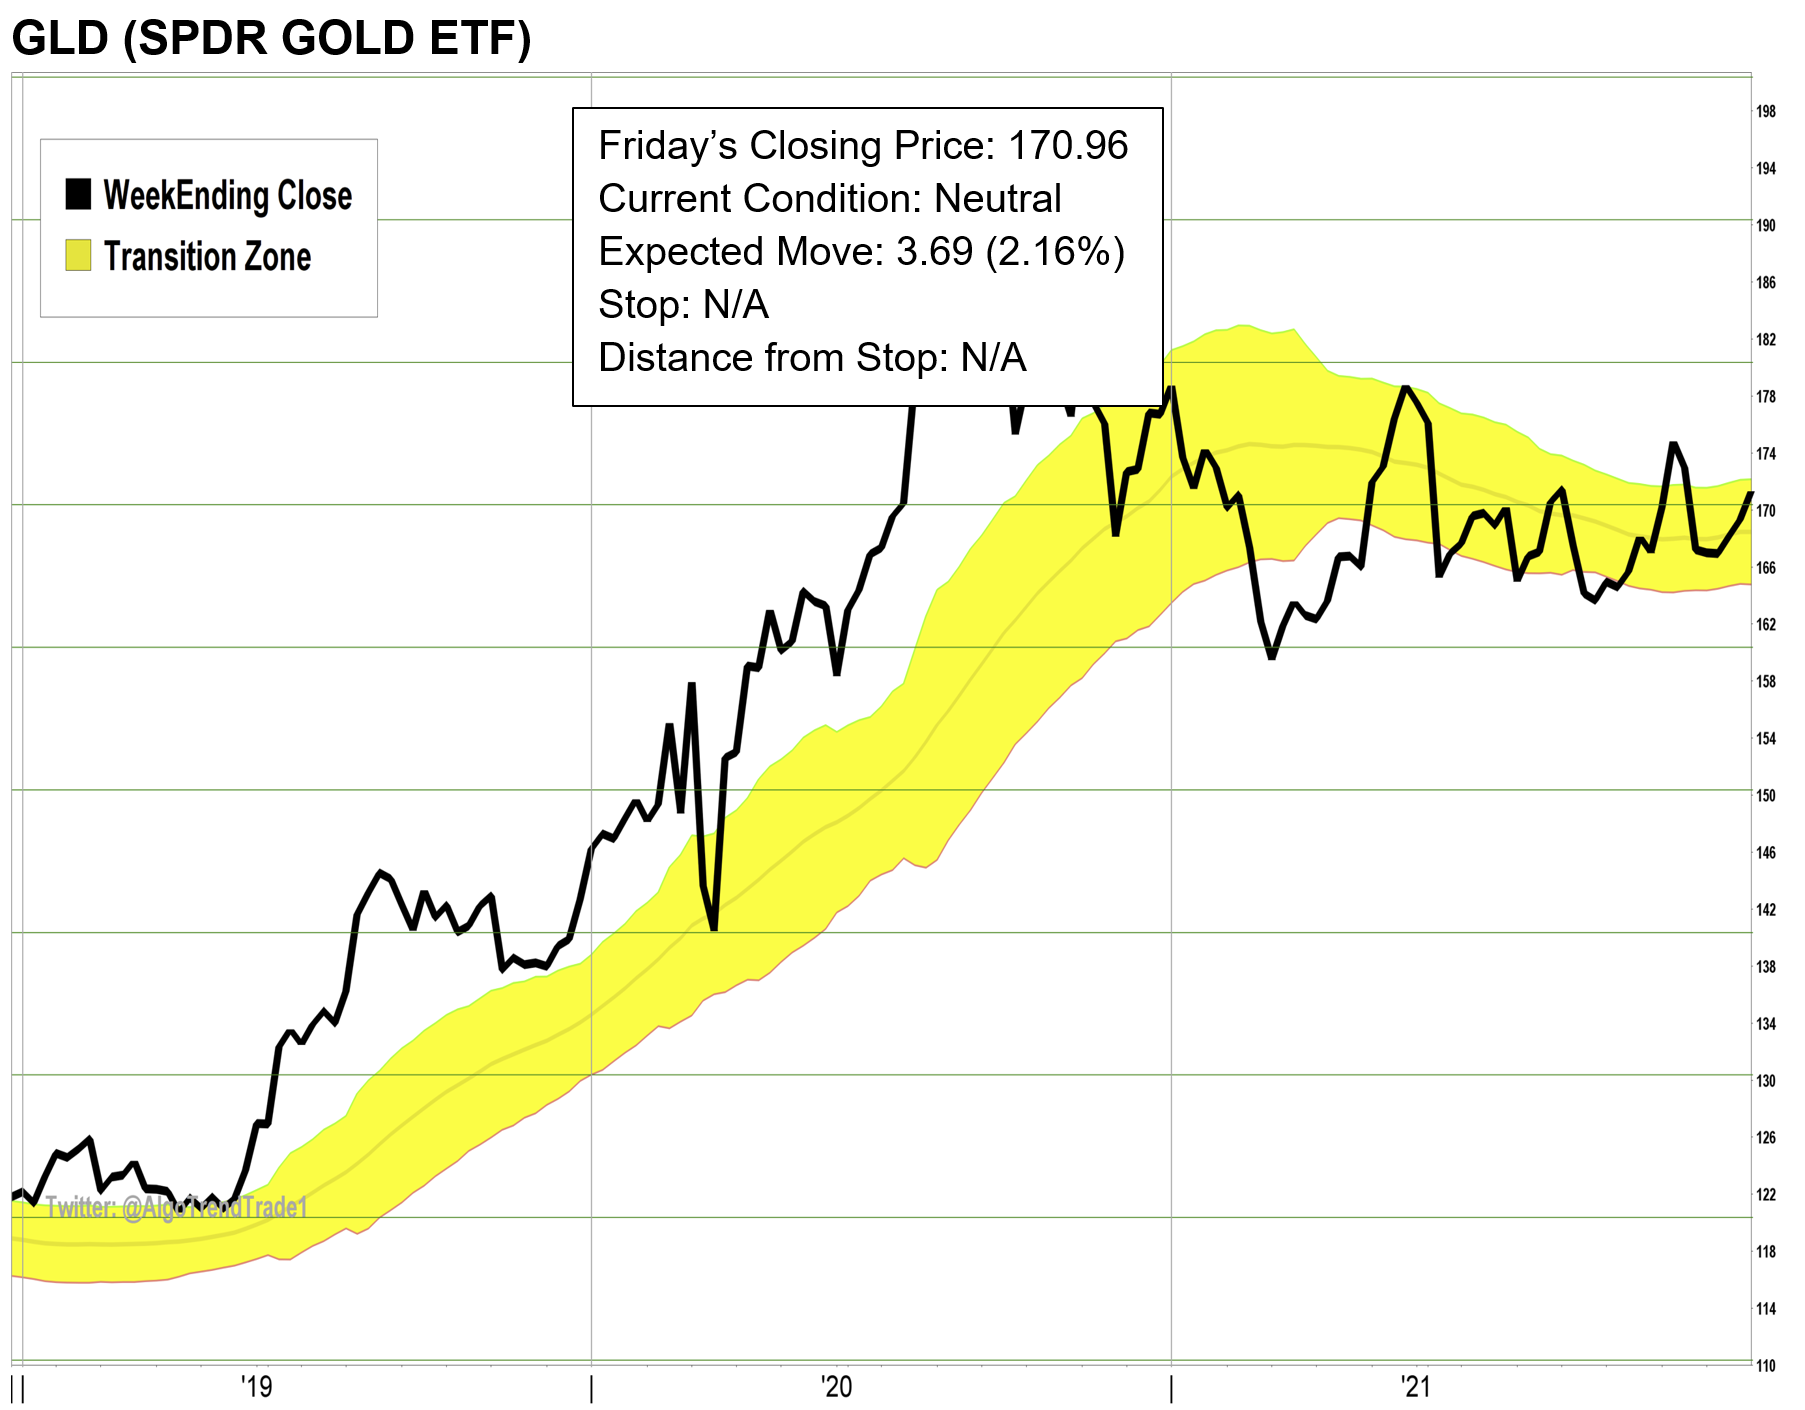
GLD (physical gold ETF) closed higher last week and it remains in a Neutral condition. There is no trade this week in GLD.
BTC (Bitcoin) couldn’t hold the $50,000 level and ended lower for the week. It is now trading in the lower half of the Transition Zone (TZ) and it remains in a Neutral condition. There is no trade in BTC this week.
Be Sure to Read the Disclaimer at the End of This Report
Here are the latest charts…


Trend-Trading Overview
In this weekly free report, we give you the trading signals for five of the most popular investment tickers. The signals are based on trend-following principles. Very simply, stocks stay in trends until they don’t. Trends can last a short time or they can last for months and even years at a time.
This is not a “get-rich-quick” scheme
If you’re looking to make a ton of money in a short time, you’re going to be disappointed. Trend-trading is not fancy; it’s boring, and takes time to be successful. This is a system that relies on a historically-proven process to generate solid returns on winning trades and avoid large losses on losing trades. We’re definitely the tortoise, not the hare.
Trend-following systems don’t try to guess what the next move in the markets might be. Instead, we measure the markets each week and use our algorithms to determine the current trend and the exit strategy for the current trades.
This system is the same one that was used in two paid investment newsletters for the past few years. Each of the newsletters had several different tickers, but the S&P 500 and Nasdaq 100 were used in both. Here are the updated results through September 10th from the trading signals given in these two indices since October 2019.

This means the average gain per trade in the S&P 500 (SPY ETF) was 6.66%. Had you been able to make all seven trades according to the signals, the potential gain was more than 45% with very little downside risk. For the Nasdaq 100 (QQQ ETF), the average gain was even greater at 7.20% per trade. That’s a total potential gain for the 8 trades of more than 57%. Again, the downside risk during this time that included the quickest bear market in history was limited.
The largest individual winning trade in the S&P 500 was the bearish signal generated in early March 2020. The largest winning trade in the Nasdaq 100 was the bullish signal generated in May 2020 that lasted until February 2021.
The key to the winning trades greatly outperforming the losing trades is the risk management system. If a trade moves against us, we’ll get out of the trade with a small loss. But if a trade trends higher for months at a time, we have the ability to build up substantial profits.
AlgoTrendTraders uses both trend and momentum to generate the trading signals. The yellow channel you see in the center of the charts is called the “Transition Zone”. When a stock is above the yellow channel, it’s in a Bullish condition. When it’s below the yellow channel, it’s in a Bearish condition. When it’s in the middle of the channel, it’s in a Neutral condition and there is no trade.
Selling is More Important Than Buying
Every trade has a pre-determined exit strategy. This is based on the normal volatility of the underlying ticker. Each stock has its own unique volatility. And, volatility is dynamic. It’s constantly changing. Each week, we look at the previous 52 weeks of price movement to come up with its normal weekly volatility. This is called the “Expected Move”. The Expected Move equals one week of the normal volatility of the stock or ETF being measured. Every week, the exit strategy for each ticker is updated.
The system is based on the weekly closes of the underlying tickers. All trading information and volatility calculations are based on weekly volatility. By using weekly calculations, the system ignores the day-to-day noise in the markets and is able to give better signals.
It’s easy to see the periods of time that volatility increases and decreases. As the yellow channel Transition Zone widens on the charts, the volatility is increasing. The opposite is true; when the Transition Zone narrows on the charts, the volatility is decreasing.
The best time to enter a trade is when a new signal is given. This gives you the greatest opportunity to get into a trend that could last a long time. Though it’s possible to get into a trade after a trend has been in place for a while, the risk in that trade is elevated. Consider using 1/2 or 1/3 of your normal investment for these situations.
For this report, we give signals that can be followed by both novice and more experienced investors. Novice investors can use these signals to help them manage their 401(k) and retirement plans by adjusting the signals for SPY and QQQ to match the mutual funds in their plans. Though you won’t be able to short these indices when they become bearish, you can stay away and avoid devastating losses from bear markets.
Experienced and sophisticated investors can use leverage or options, but the risk is substantially greater. Never risk more money than you can afford to lose.
Disclaimer:
The information published in this newsletter should not be used to make personal investment decisions. We are not licensed by any federal or state entity to give investment advice. We do not know your personal financial situation. Investments should be made only after consulting with your professional investment advisor and only after reviewing the prospectuses or financial statements of the companies in which you’re considering investing.