AlgoTrendTraders Free Weekly Report - August 2, 2021
Disciplined, rules-based investing

Follow us on Twitter: AlgoTrendTrade1
AlgoTrendTraders Free Weekly Report
Be Sure to Read the Disclaimer at the End of This Report
Welcome to this week’s AlgoTrendTraders report. Before we get into this week’s report, we’d like to ask you to be sure to follow us on Twitter. Each day, we’ll update our Twitter account with charts of additional stocks, ETFs, commodities, and cryptos. Later today, we’ll be posting the chart for Ethereum which just entered into a new Bullish condition last week. Thank you.
In this free report, we give you the trading signals for five of the most popular investment tickers. The signals are based on trend-following principles. Very simply, stocks stay in trends until they don’t. Trends can last a short time or they can last for months at a time.
Trend-following systems don’t try to guess what the next move in the markets might be. Instead, we measure the markets each week and use our algorithms to determine the current trend and the exit strategy for the current trade.
This system is the same one that’s been used in two paid investment newsletters for the past few years. Each newsletter has several different tickers, but the S&P 500 and Nasdaq 100 are used in both. Here are the results from the trading signals given in these two indices since October 2019.

The key to the winning trades greatly outperforming the losing trades is the risk management system. If a trade moves against us, we’ll get out of the trade with a small loss. But if a trade trends higher for months at a time, we have the ability to build up substantial profits.
The largest individual winning trade in the S&P 500 was the bearish signal generated in early March 2020. The largest winning trade in the Nasdaq 100 was the bullish signal generated in May 2020 that lasted until February 2021.
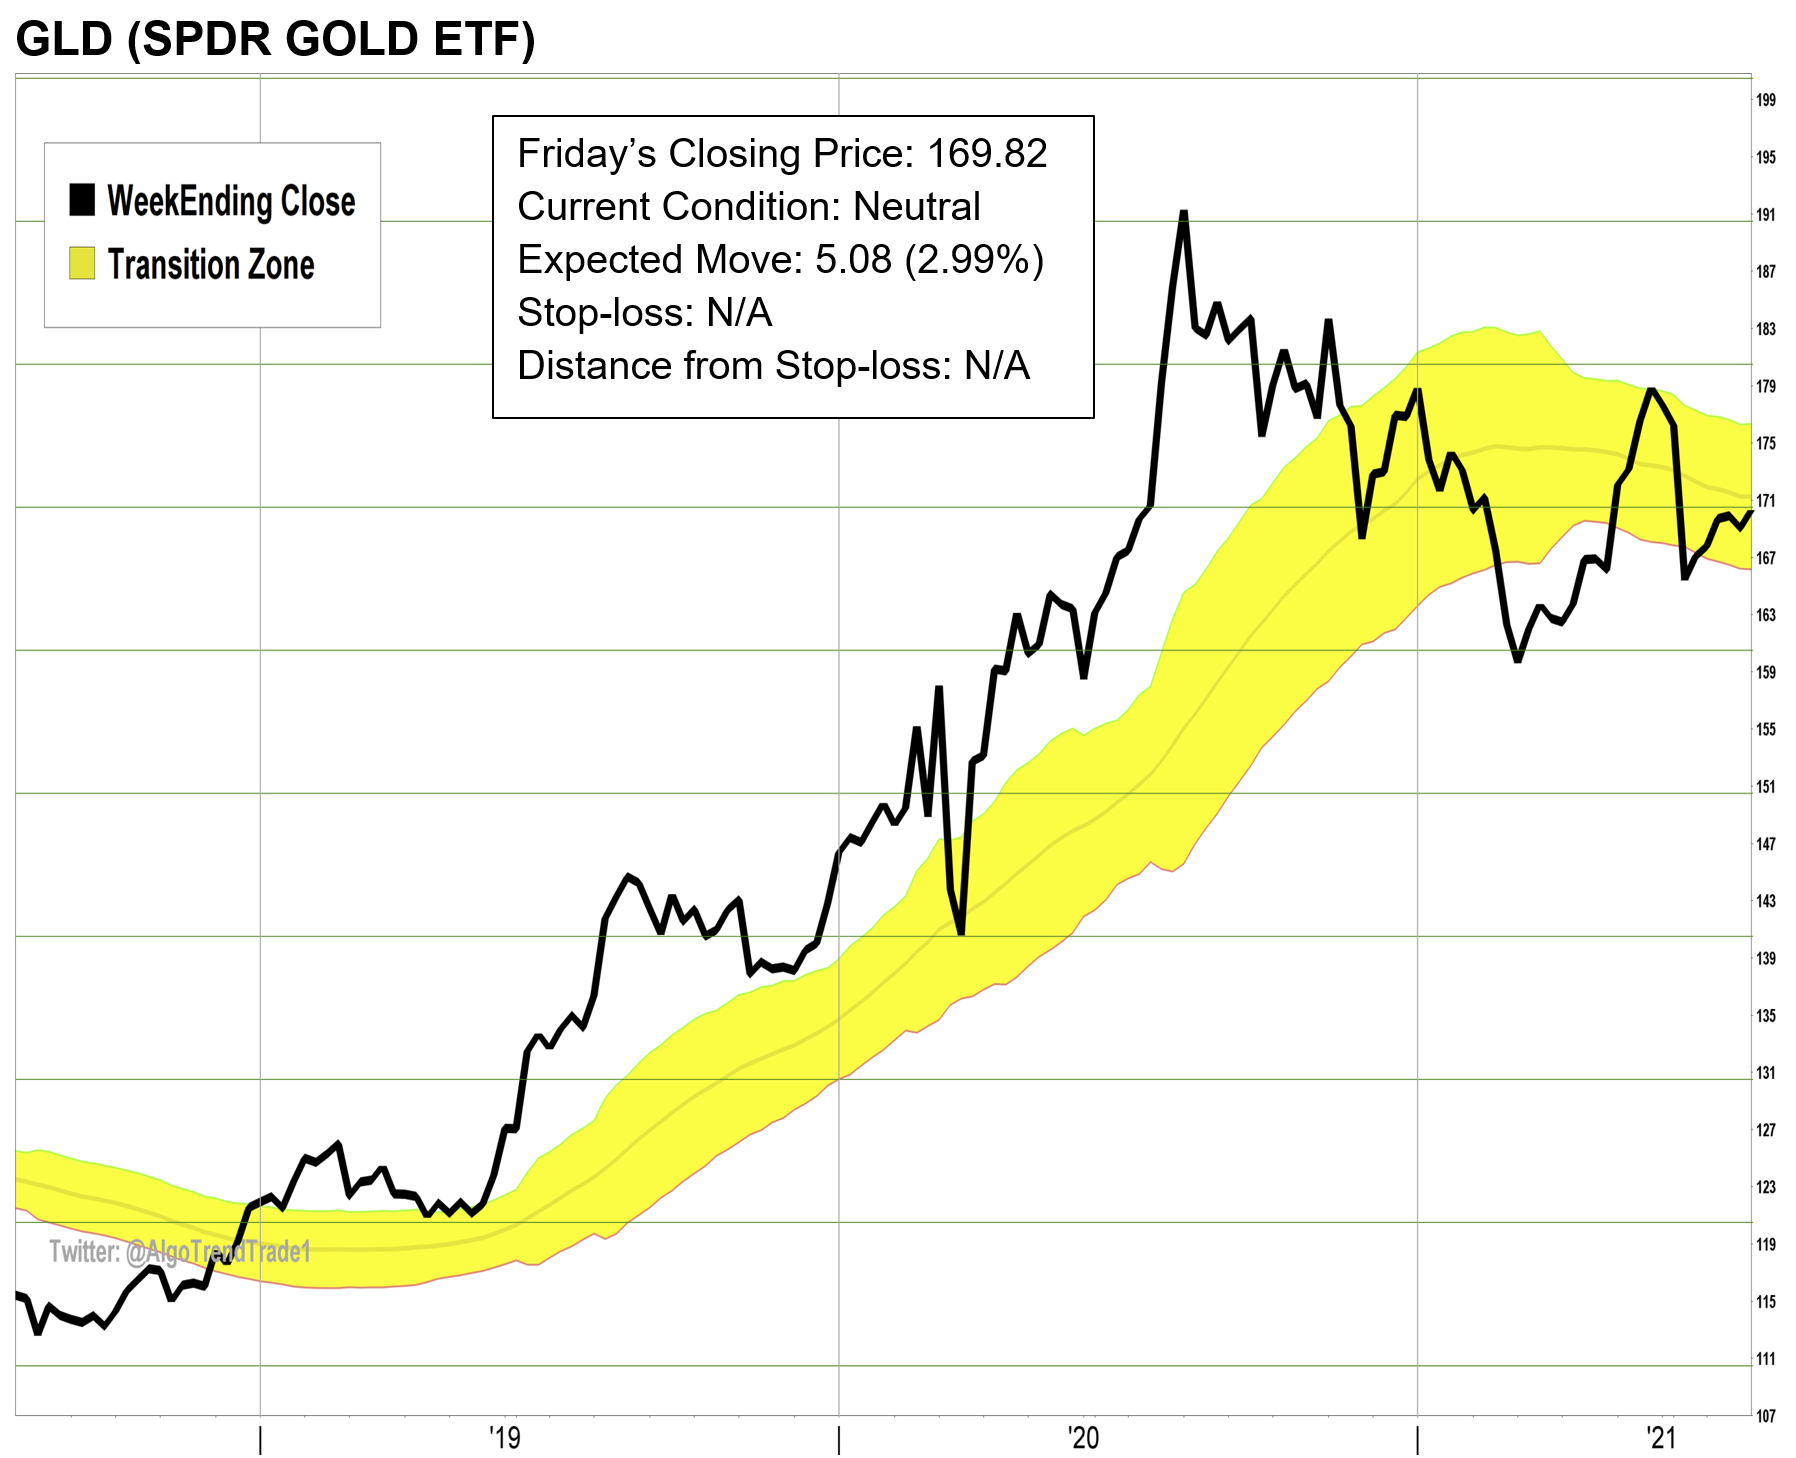
AlgoTrendTraders uses both trend and momentum to generate the trading signals. The yellow channel you see in the center of the charts is called the “Transition Zone”. When a stock is above the yellow channel, it’s in a Bullish condition. When it’s below the yellow channel, it’s in a Bearish condition. When it’s in the middle of the channel, it’s in a Neutral condition and there is no trade.
Selling is More Important Than Buying
Every trade has a pre-determined exit strategy. This is based on the normal volatility of the underlying ticker. Each week, we look at the previous 52 weeks of price movement to come up with its normal weekly volatility. This is called the “Expected Move”. The Expected Move equals one week of the normal volatility of the stock or ETF being measured. Each week, the exit strategy for each ticker is updated.
The system is based on the weekly closes of the underlying tickers. All trading information and volatility calculations are based on weekly volatility. By using weekly calculations, the system ignores the day-to-day noise in the markets and is able to give better signals.
It’s easy to see the periods of time that volatility increases and decreases. As the yellow channel Transition Zone widens on the charts, the volatility is increasing. The opposite is true; when the Transition Zone narrows on the charts, the volatility is decreasing.
The Composite Table shows the condition of the current trades and their exit strategies. The individual charts underneath the Table shows the weekly update and when the current trade began.
The best time to enter a trade is when a new signal is given. This gives you the greatest opportunity to get on a trend that could last a long time. Though it’s possible to get into a trade after a trend has been in place for a while, the risk in that trade is elevated. Consider using 1/2 or 1/3 of your normal investment for these situations.
For this report, we give signals that can be followed by both novice and more experienced investors. Novice investors can use these signals to help them manage their 401(k) and retirement plans by adjusting the signals for SPY and QQQ to match the mutual funds in their plans. Though you won’t be able to short these indices when they become bearish, you can stay away and avoid devastating losses from bear markets. Next week, we’ll show you how to adjust your mutual funds to use the signals and risk parameters we follow each week.
Experienced and sophisticated investors can use leverage or options, but the risk is substantially greater. Never risk more money than you can afford to lose.
Be sure to prepare your exit strategies before you enter into any trade. That’s the key to successful investing.
The Composite Table for August 2, 2021

SPY dropped a little last week and closed off its all-time high. It remains in a Bullish condition. The stop moved up to 412.14 which is 1.3 Expected Moves (EM) from Friday’s close.
QQQ also fell last week, but it remains in a Bullish condition. The stop moved up to 340.72 which is 1.3 EM from Friday’s close.
ARKK moved lower last week, but it remains near the middle of the yellow channel Transition Zone (TZ) in a Neutral condition. There is no trade this week in ARKK.
GLD moved slightly higher last week and moved into the middle of the TZ. It is still in a Neutral condition. There is no trade this week in GLD.
BTC (Bitcoin) continued its move from the lower end of the TZ last week up above the $42,000 level, but it ended the week in the upper half of the TZ and above $41,000. It remains in a Neutral condition. There is no trade this week in BTC. We will update the condition of BTC throughout the week on Twitter.
Now here are the latest charts…


Disclaimer:
The information published in this newsletter should not be used to make personal investment decisions. We are not licensed by any federal or state entity to give investment advice. We do not know your personal financial situation. Investments should be made only after consulting with your professional investment advisor and only after reviewing the prospectuses or financial statements of the companies in which you’re considering investing.