
AlgoTrendTraders
Thomas Meyer, Editor
August 16, 2021
Twitter: @AlgoTrendTrade1
Email: algotrendtraders@gmail.com
Be Sure to Read the Disclaimer at the End of This Report
Welcome to this week’s AlgoTrendTraders report. Before we get into this week’s report, we’d like to ask you to be sure to follow us on Twitter. Each day, we’ll update Twitter with charts of additional stocks, ETFs, commodities, and cryptos.
A mistake that many investors make is reacting to the news of the day. Covid, the Delta variant, Afghanistan, inflation, deflation, earnings, etc. can all make investors react. In reality, none of these matters.
You might be thinking… “Tom, how can none of that matter? The market reacts and even overreacts to the news all the time. It’s the news of the day that moves the markets.”
And that’s the nuance. We don’t care what the news is, we only care about how the markets react to the news. For instance, when news of the Delta variant was beginning to make headlines a month ago, most people would have thought that the markets would take a hit. We know with perfect hindsight that the markets have moved higher in spite of this news.
That’s why we measure the markets and don’t try to guess. That’s why we always have our exit strategies determined in advance. We’re all geniuses as to what we could have done or should have done on the left hand side of the chart, but we don’t invest in the past. We invest in the present with our eyes to the future and take reasonable risk in case a trade moves against us.
Successful investors don’t react to the news, they react to the market’s reaction to the news.
This week, there are no new trades. On Sunday afternoon, Bitcoin looked as if it might stay above the yellow channel Transition Zone (TZ) and trigger a new Bullish trade. It ultimately closed for the week just inside the TZ and is still in a Neutral condition. Though it’s tempting to get into Bitcoin, trend trading requires patience, discipline, and commitment to the process.
Each week in this free report, we give you the trading signals for five of the most popular investment tickers. The signals are based on trend-following principles. Very simply, stocks stay in trends until they don’t. Trends can last a short time or they can last for months at a time.
Trend trading is not fancy, it’s boring, and if you’re looking for a quick hit, this isn’t it. This is a system that relies on a historically-proven process to generate solid returns on winning trades and avoid large losses on losing trades.
Trend-following systems don’t try to guess what the next move in the markets might be. Instead, we measure the markets each week and use our algorithms to determine the current trend and the exit strategy for the current trade.
This system is the same one that’s been used in two paid investment newsletters for the past few years. Each newsletter has several different tickers, but the S&P 500 and Nasdaq 100 are used in both. Here are the updated results from the trading signals given in these two indices since October 2019.
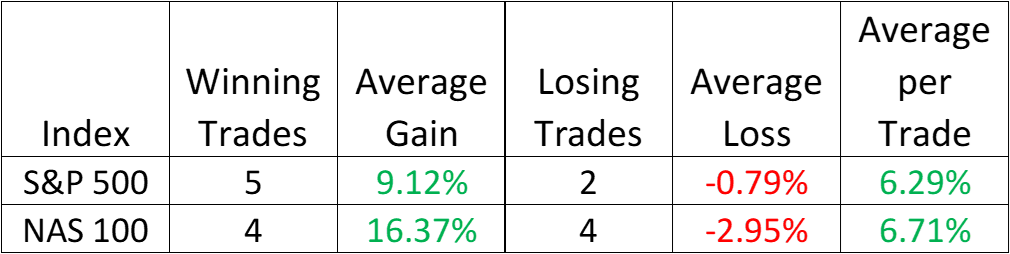
The key to the winning trades greatly outperforming the losing trades is the risk management system. If a trade moves against us, we’ll get out of the trade with a small loss. But if a trade trends higher for months at a time, we have the ability to build up substantial profits.
The largest individual winning trade in the S&P 500 was the bearish signal generated in early March 2020. The largest winning trade in the Nasdaq 100 was the bullish signal generated in May 2020 that lasted until February 2021.
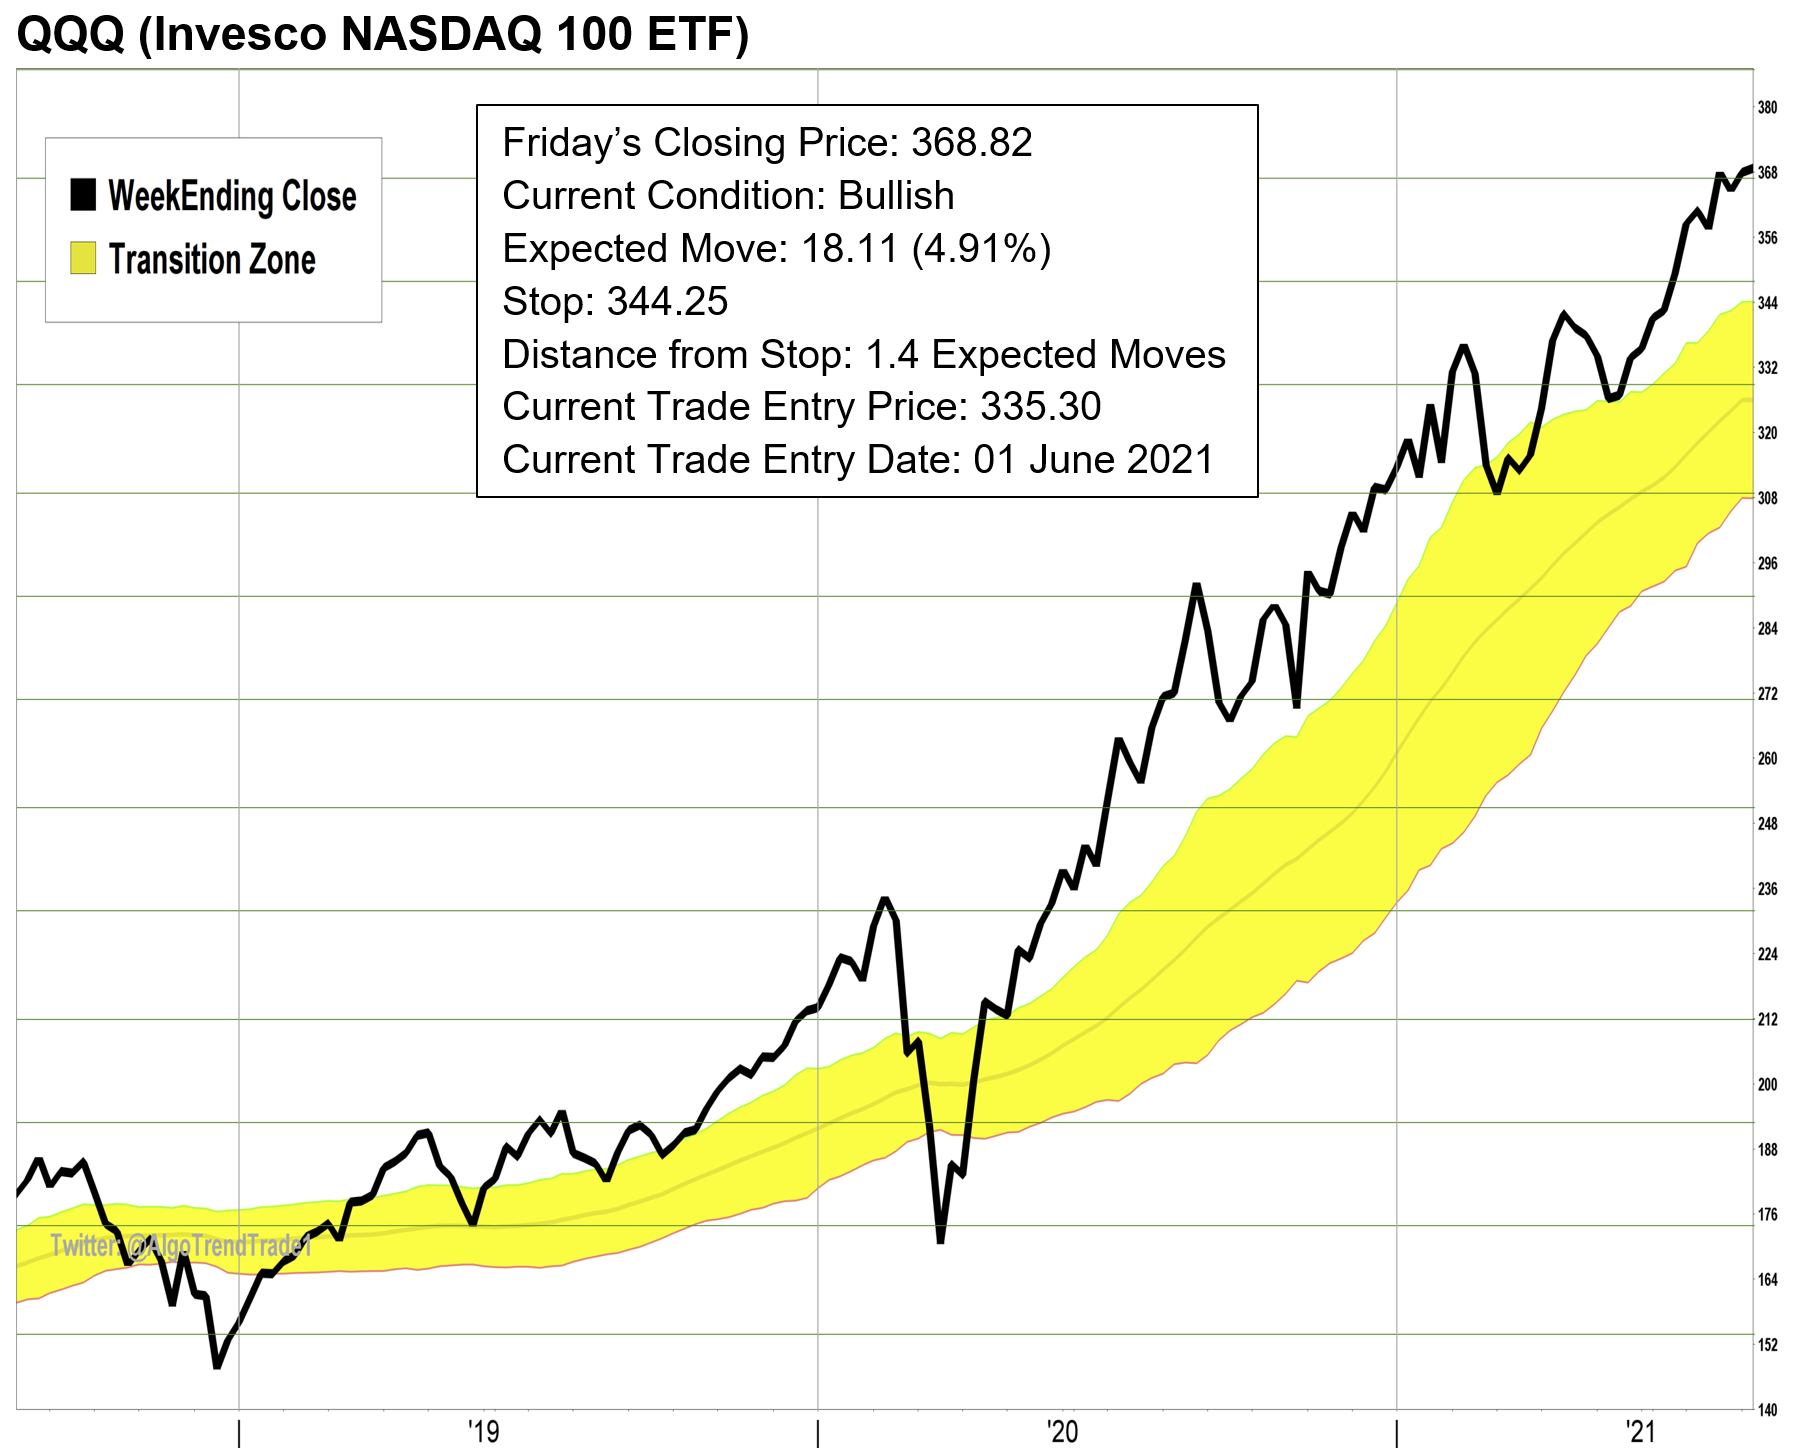
AlgoTrendTraders uses both trend and momentum to generate the trading signals. The yellow channel you see in the center of the charts is called the “Transition Zone”. When a stock is above the yellow channel, it’s in a Bullish condition. When it’s below the yellow channel, it’s in a Bearish condition. When it’s in the middle of the channel, it’s in a Neutral condition and there is no trade.
Selling is More Important Than Buying
Every trade has a pre-determined exit strategy. This is based on the normal volatility of the underlying ticker. Each week, we look at the previous 52 weeks of price movement to come up with its normal weekly volatility. This is called the “Expected Move”. The Expected Move equals one week of the normal volatility of the stock or ETF being measured. Each week, the exit strategy for each ticker is updated.
The system is based on the weekly closes of the underlying tickers. All trading information and volatility calculations are based on weekly volatility. By using weekly calculations, the system ignores the day-to-day noise in the markets and is able to give better signals.
It’s easy to see the periods of time that volatility increases and decreases. As the yellow channel Transition Zone widens on the charts, the volatility is increasing. The opposite is true; when the Transition Zone narrows on the charts, the volatility is decreasing.
The best time to enter a trade is when a new signal is given. This gives you the greatest opportunity to get on a trend that could last a long time. Though it’s possible to get into a trade after a trend has been in place for a while, the risk in that trade is elevated. Consider using 1/2 or 1/3 of your normal investment for these situations.
For this report, we give signals that can be followed by both novice and more experienced investors. Novice investors can use these signals to help them manage their 401(k) and retirement plans by adjusting the signals for SPY and QQQ to match the mutual funds in their plans. Though you won’t be able to short these indices when they become bearish, you can stay away and avoid devastating losses from bear markets.
The financial industry loves to tell you that buying and holding is how you make money in the stock market. And historically, that’s true… if you never need to access your money. But most investors will need the money they’ve saved up for decades to support their lives during retirement. If the money you count on to help you through retirement drops during a bear market by 50% or more, will you still be able to live the same lifestyle you had counted on for the rest of your life? That’s why it’s important to protect your money during downtrends, move your retirement funds to cash, and wait for a new uptrend to develop before moving back into the market.
At the end of this report, underneath the disclaimer, we give you an example how to adjust your mutual funds to use these signals and risk parameters we follow each week.
Experienced and sophisticated investors can use leverage or options, but the risk is substantially greater. Never risk more money than you can afford to lose.
Be sure to prepare your exit strategies before you enter into any trade. That’s the key to successful investing.
The Composite Table for August 16, 2021

SPY moved higher last week and set a new all-time week-closing high. It remains in a Bullish condition. The stop moved up to 417.60 which is 1.4 Expected Moves (EM) from Friday’s close.
QQQ also moved higher last week and set a new all-time week-ending high. It remains in a Bullish condition. The stop moved up to 344.25 which is 1.4 EM from Friday’s close.
ARKK moved lower for the week and it remains near the middle of the yellow channel Transition Zone (TZ) close to its 200-day moving average. It remains in a Neutral condition. There is no trade this week in ARKK.
GLD dropped sharply at the beginning of the week, but climbed higher as interest rates moved lower towards the end of the week. It remains in a Bearish condition. The listed stop on the current trade is 169.56 which is 0.7 EM from Friday’s closing price.
BTC continued its move higher for most of last week, but it still closed inside the Transition Zone and it remains in a Neutral condition. There is no trade this week in BTC. We will update the condition of BTC throughout the week on Twitter.
Now here are the latest charts…

Disclaimer:
The information published in this newsletter should not be used to make personal investment decisions. We are not licensed by any federal or state entity to give investment advice. We do not know your personal financial situation. Investments should be made only after consulting with your professional investment advisor and only after reviewing the prospectuses or financial statements of the companies in which you’re considering investing.
Adjusting the Trading Signals for Mutual Funds
One of the most popular funds in 401(k) plans is the Fidelity 500 Index Fund (ticker symbol FXAIX). This is a fund that is a clone of the S&P 500 Index. It’s going to have most of the same characteristics as the S&P 500 ETF (SPY) we follow in this report.
FXAIX closed this past Friday at $155.26. Here’s how to manage the exit strategy for FXAIX using the statistics we have in this report for SPY.
First, we want to determine the normal volatility for FXAIX. That’s the Expected Move (EM). This week, the EM for SPY was 4.64%. We’ll take the price of FXAIX and multiply by the EM to determine the numeric value.
$155.26 x 4.64% = $7.20 (rounded off)
Currently, the stop for SPY = 1.4 EM from the Friday close. Let’s determine the amount of FXAIX that’s equal to 1.4 EM.
$7.20 x 1.4 = $10.08
Now we can subtract 1.4 EM from the closing price of FXAIX to determine the proper exit price.
$155.26 - $10.08 = $145.16
If FXAIX closes below $145.16, that means the uptrend and the momentum have been broken according to the system and you should move to a cash position. It doesn’t mean that a new bearish trend has begun. FXAIX will be trading inside the Transition Zone and waiting for a new trend to develop. When a new uptrend begins, you could re-enter into the position.
You can use these same steps for any of your mutual funds that are similar to the ETFs we follow in this report.